


Key for TF-TF Network Image
Circle: TF-specificity Green: TRM-specific Brown: TEXterm-specific
Line thickness: TF-TF interaction intensity
Line color: Green: TF-TF interaction found in TRM, Brown: TF-TF interaction found in TEXterm
Please sign in with your Hugging Face account to continue.
Caption for the csdescrip image.
This website serves as a companion resource to our study, 'Multi-Omics Atlas-Assisted Discovery of Transcription Factors for Selective T Cell State Programming.' It is designed to make the bioinformatics analyses and data from the study accessible to researchers from diverse backgrounds, including those without extensive bioinformatics expertise. The platform provides comprehensive tools to explore transcription factor (TF) activities across distinct T cell states, enabling users to examine TF scores for specific cell states, multi-state TFs and their regulatory roles, visualize TF relationships using wave and network analyses and access a searchable database of TF scores and multi-omics data. Explore our TF catalog, network analyses, and more to uncover insights into our study.
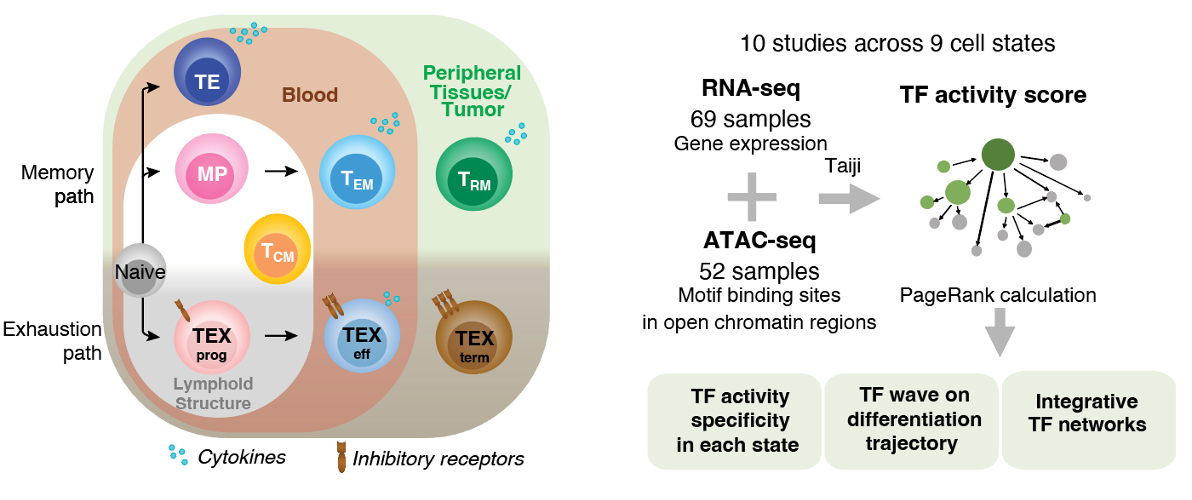
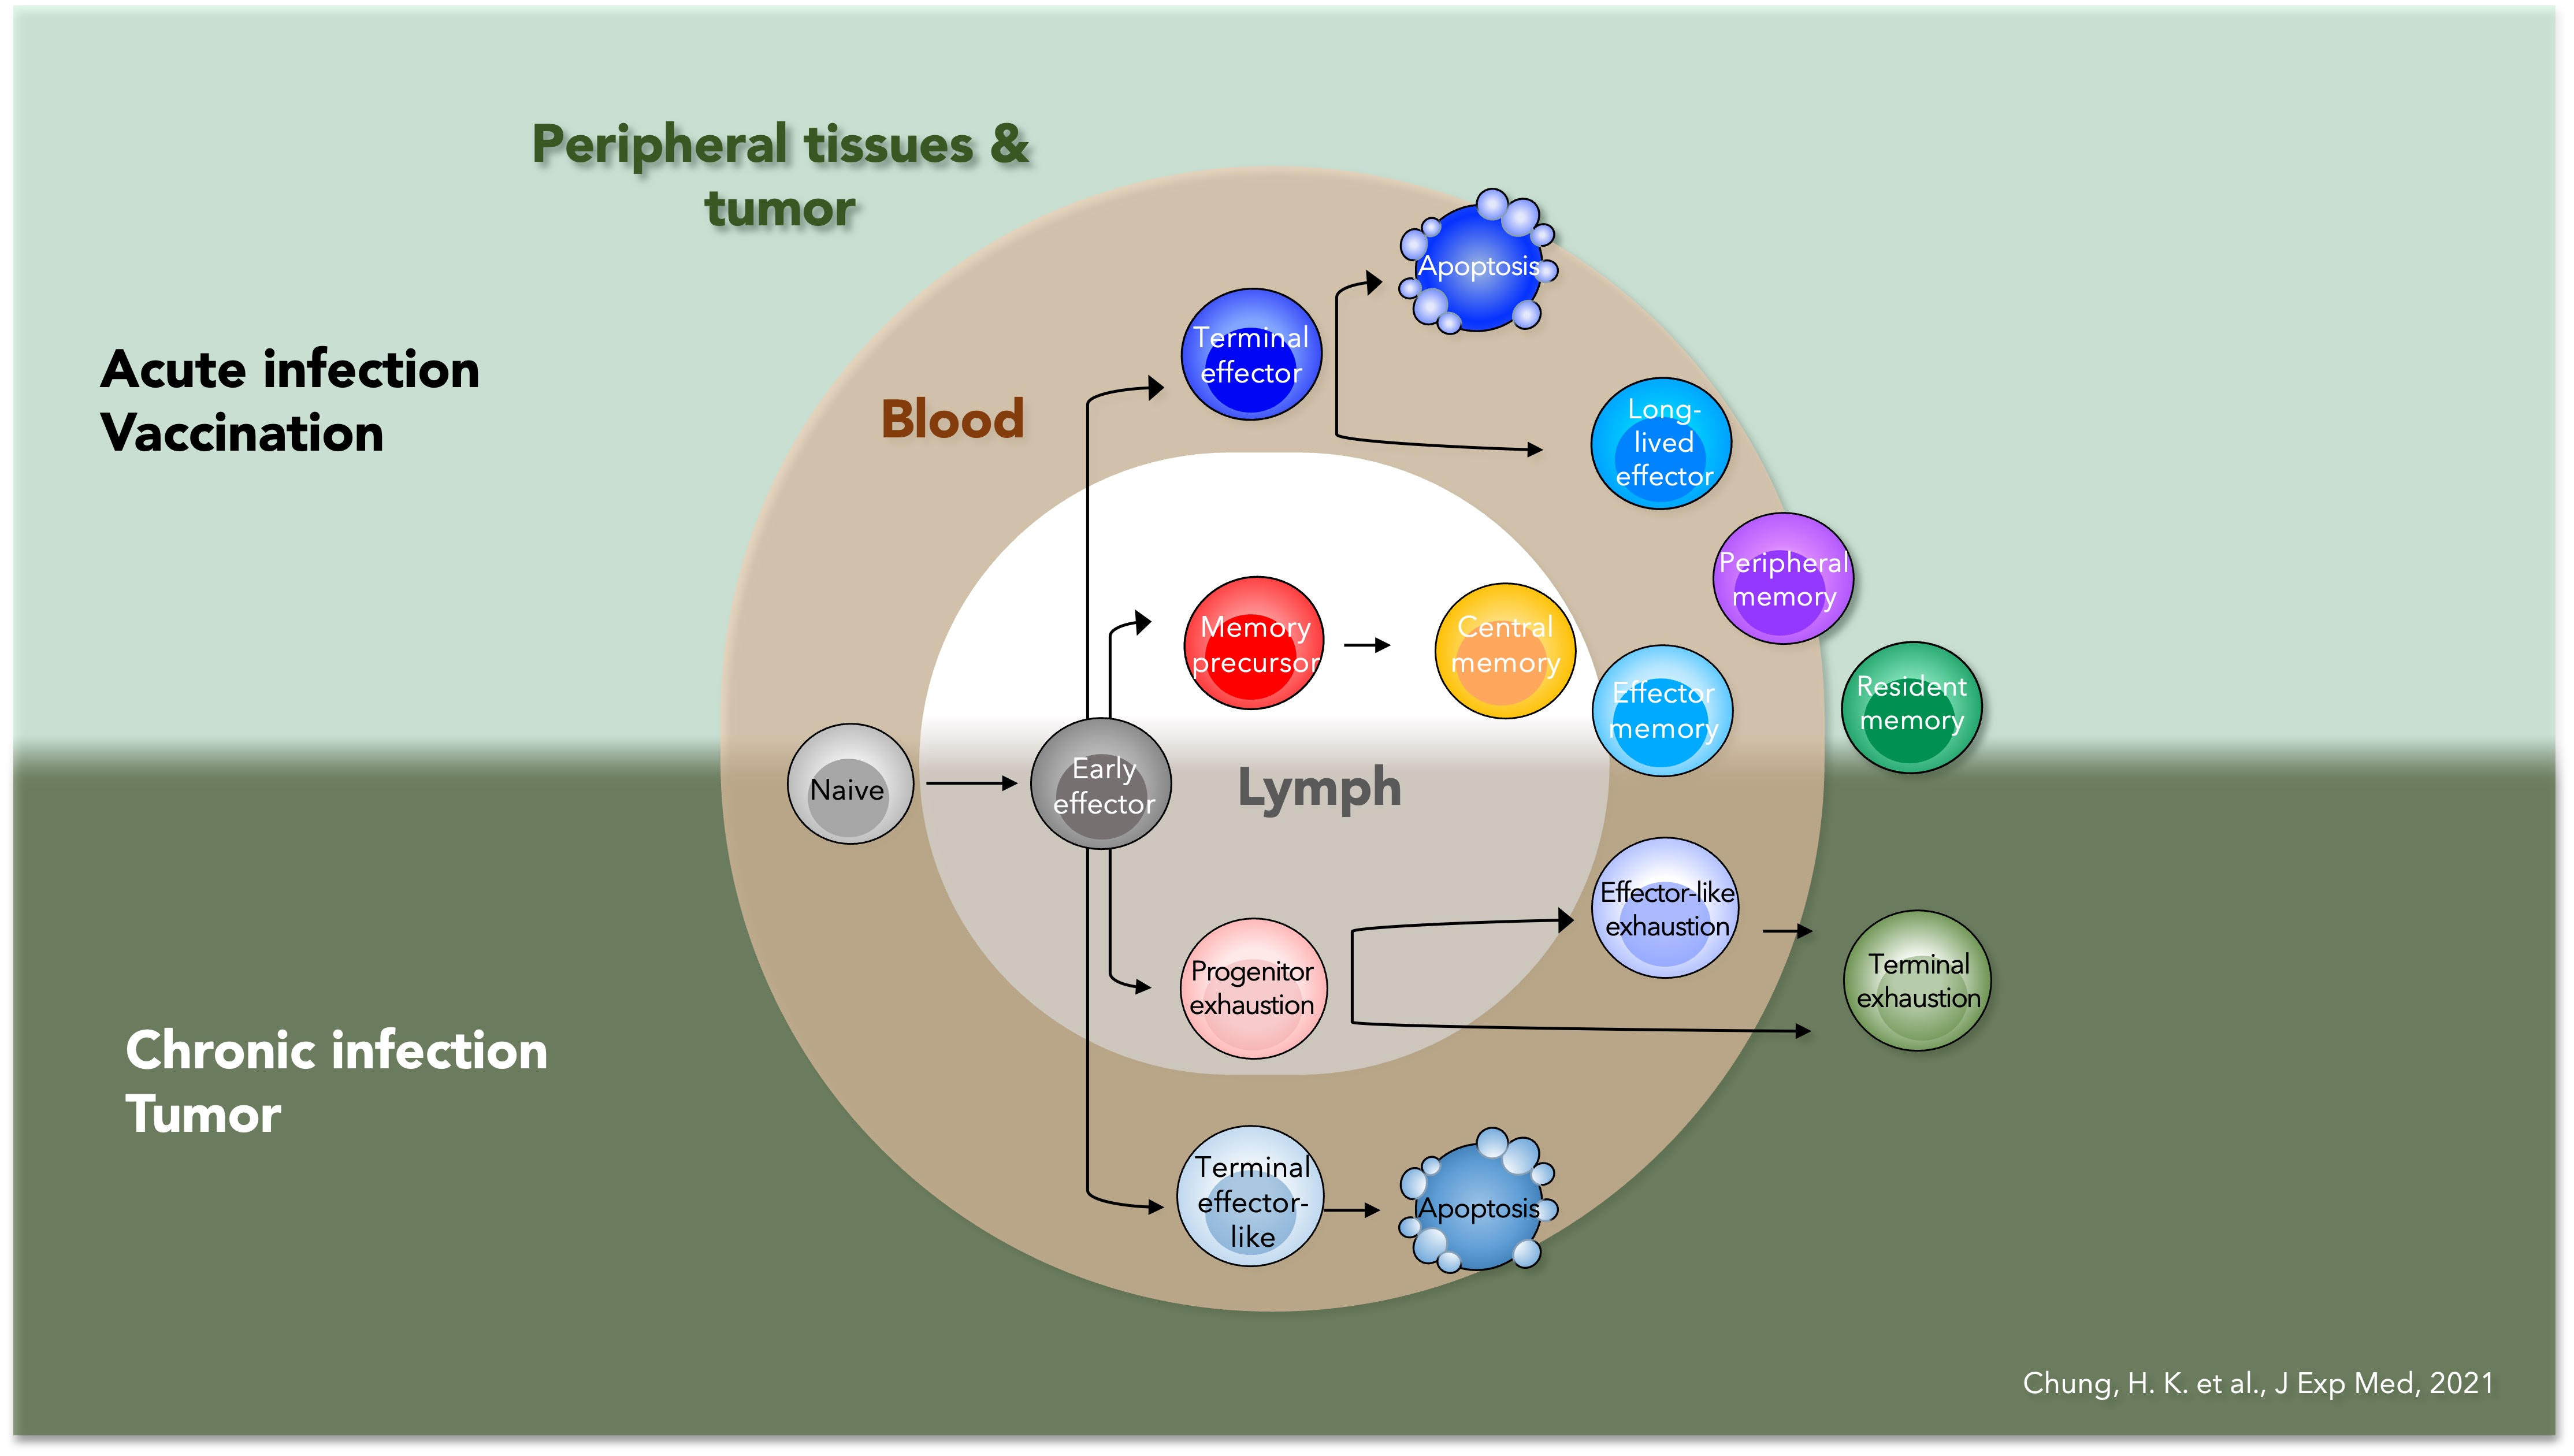
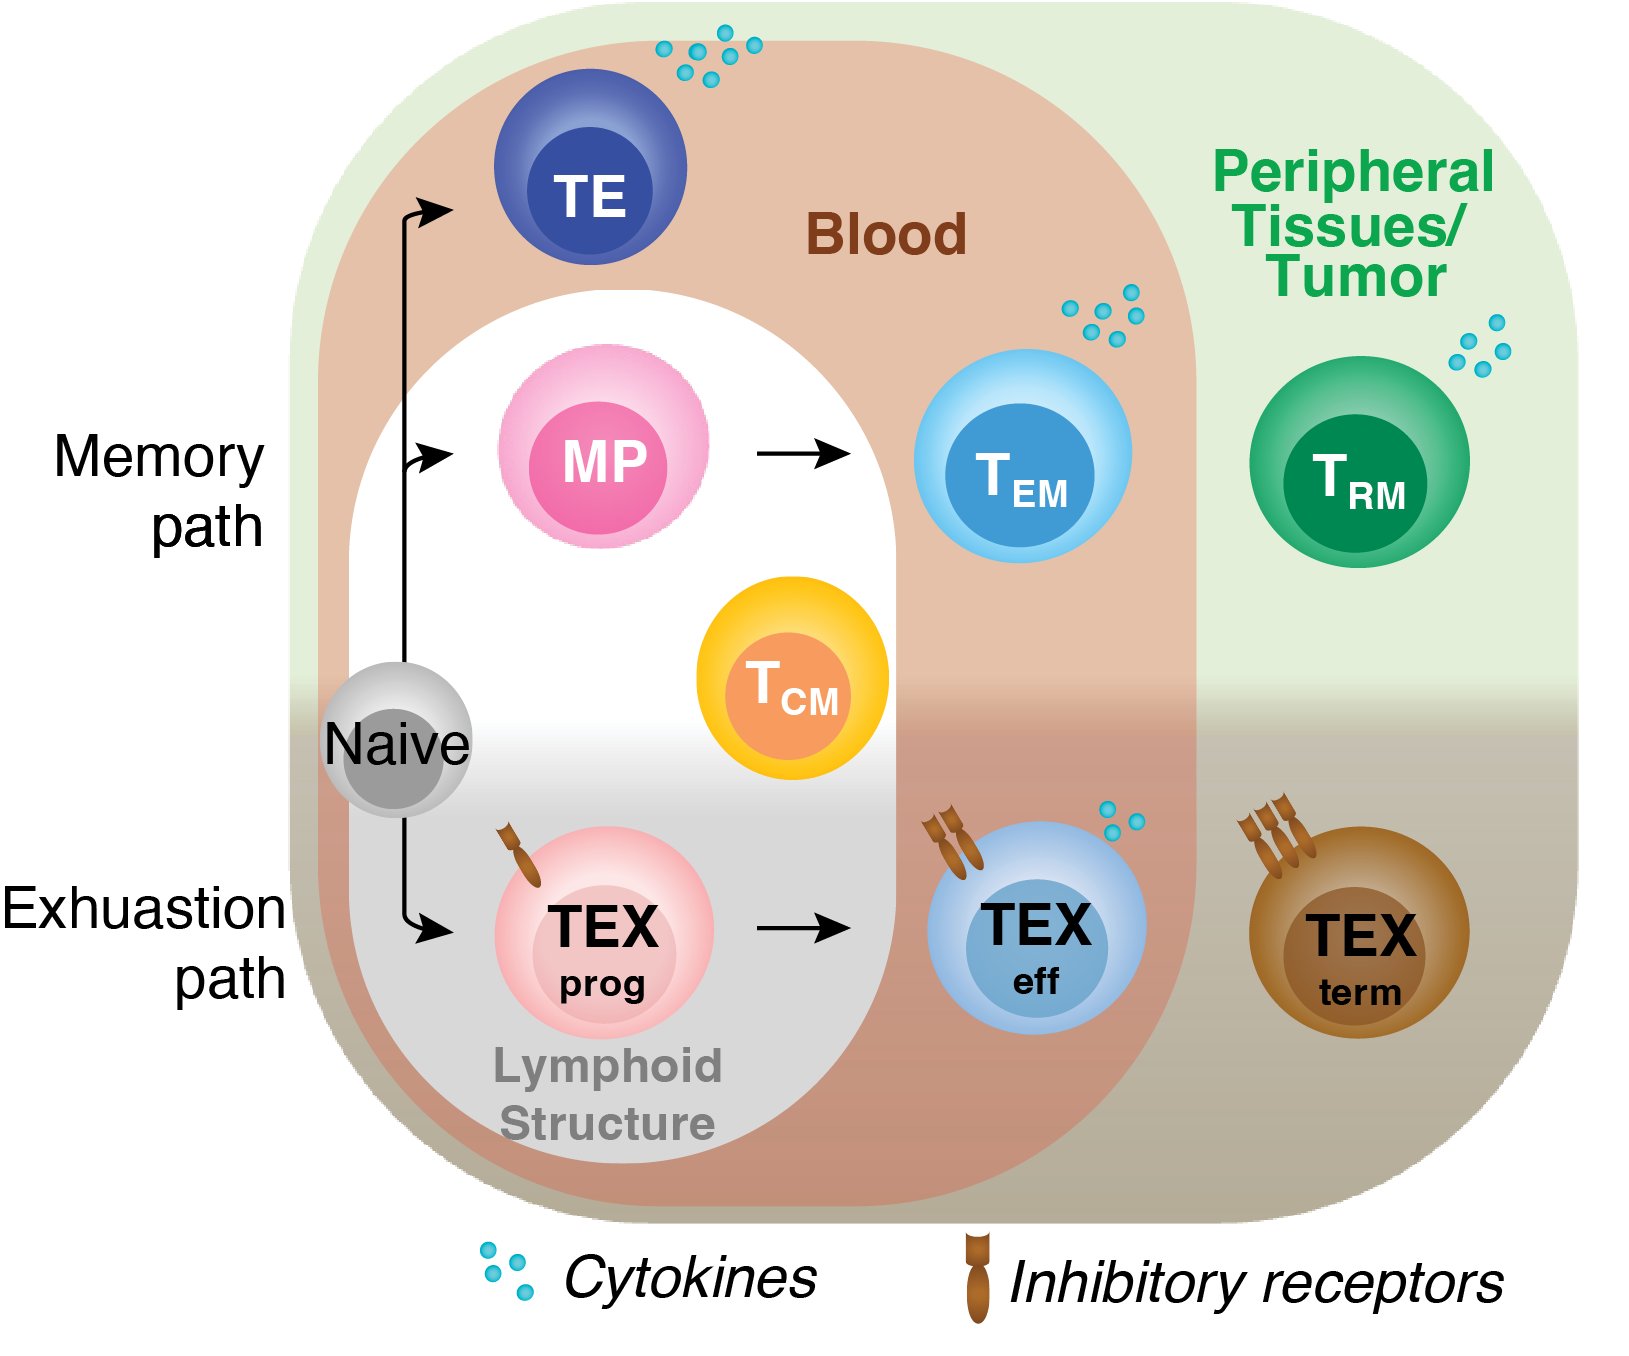
Naive T cells adopt diverse states in various contexts, such as acute or chronic infections and tumors. Upon activation, they become early effector (EE) cells that differentiate into distinct CD8+ T cell subsets with varied trafficking patterns—residing in lymphoid organs, blood, or peripheral tissues.
In acute infection, TE (Terminal Effector) cells are found in the spleen or blood, while MP (Memory Precursor) cells mainly reside in lymphoid structures. TCM (Central Memory) and TEM (Effector Memory) cells circulate in the blood, with TCM predominant in lymphoid organs and TEM in tissues. TPM cells circulate throughout lymph, blood, and tissues, while TRM (Tissue-Resident Memory) cells stay long-term in tissues.
Similarly, chronic infections or tumors induce T cell states through chronic antigen exposure, leading to a spectrum of exhaustion, from TEXprog (Progenitor) to TEXterm (Terminal). These cells lose function over time, with TEXterm becoming dysfunctional.
In this study, we developed a pipeline to analyze transcription factor regulation across CD8+ T cell states, enabling therapeutic manipulation. Using 121 experiments, we created an epigenetic and transcription atlas of 9 cell states, allowing an unbiased analysis of unique and shared transcription factor activities across memory and exhaustion contexts.
Transcription factors (TFs) regulate the differentiation of T cells into diverse states with distinct functionalities. To precisely program desired T cell states in viral infections and cancers, we generated a comprehensive transcriptional and epigenetic atlas of nine CD8+ T cell differentiation states for TF activity prediction. Our analysis catalogued TF activity fingerprints of each state, uncovering new regulatory mechanisms that govern selective cell state differentiation. Leveraging this platform, we focused on two critical T cell states in tumor and virus control: terminally exhausted T cells (TEXterm), which are dysfunctional, and tissue-resident memory T cells (TRM), which are protective. Despite their functional differences, these states share significant transcriptional and anatomical similarities, making it both challenging and essential to engineer T cells that avoid TEXterm differentiation while preserving beneficial TRM characteristics. Through in vivo CRISPR screening combined with single-cell RNA sequencing (Perturb-seq), we validated the specific TFs driving the TEXterm state and confirmed the accuracy of TF specificity predictions. Importantly, we discovered novel TEXterm-specific TFs such as ZSCAN20, JDP2, and ZFP324. The deletion of these TEXterm-specific TFs in T cells enhanced tumor control and synergized with immune checkpoint blockade. Additionally, this study identified multi-state TFs like HIC1 and GFI1, which are vital for both TEXterm and TRM states. Furthermore, our global TF community analysis and Perturb-seq experiments revealed how TFs differentially regulate key processes in TRM and TEXterm cells, uncovering new biological pathways like protein catabolism that are specifically linked to TEXterm differentiation. In summary, our platform systematically identifies TF programs across diverse T cell states, facilitating the engineering of specific T cell states to improve tumor control and providing insights into the cellular mechanisms underlying their functional disparities.
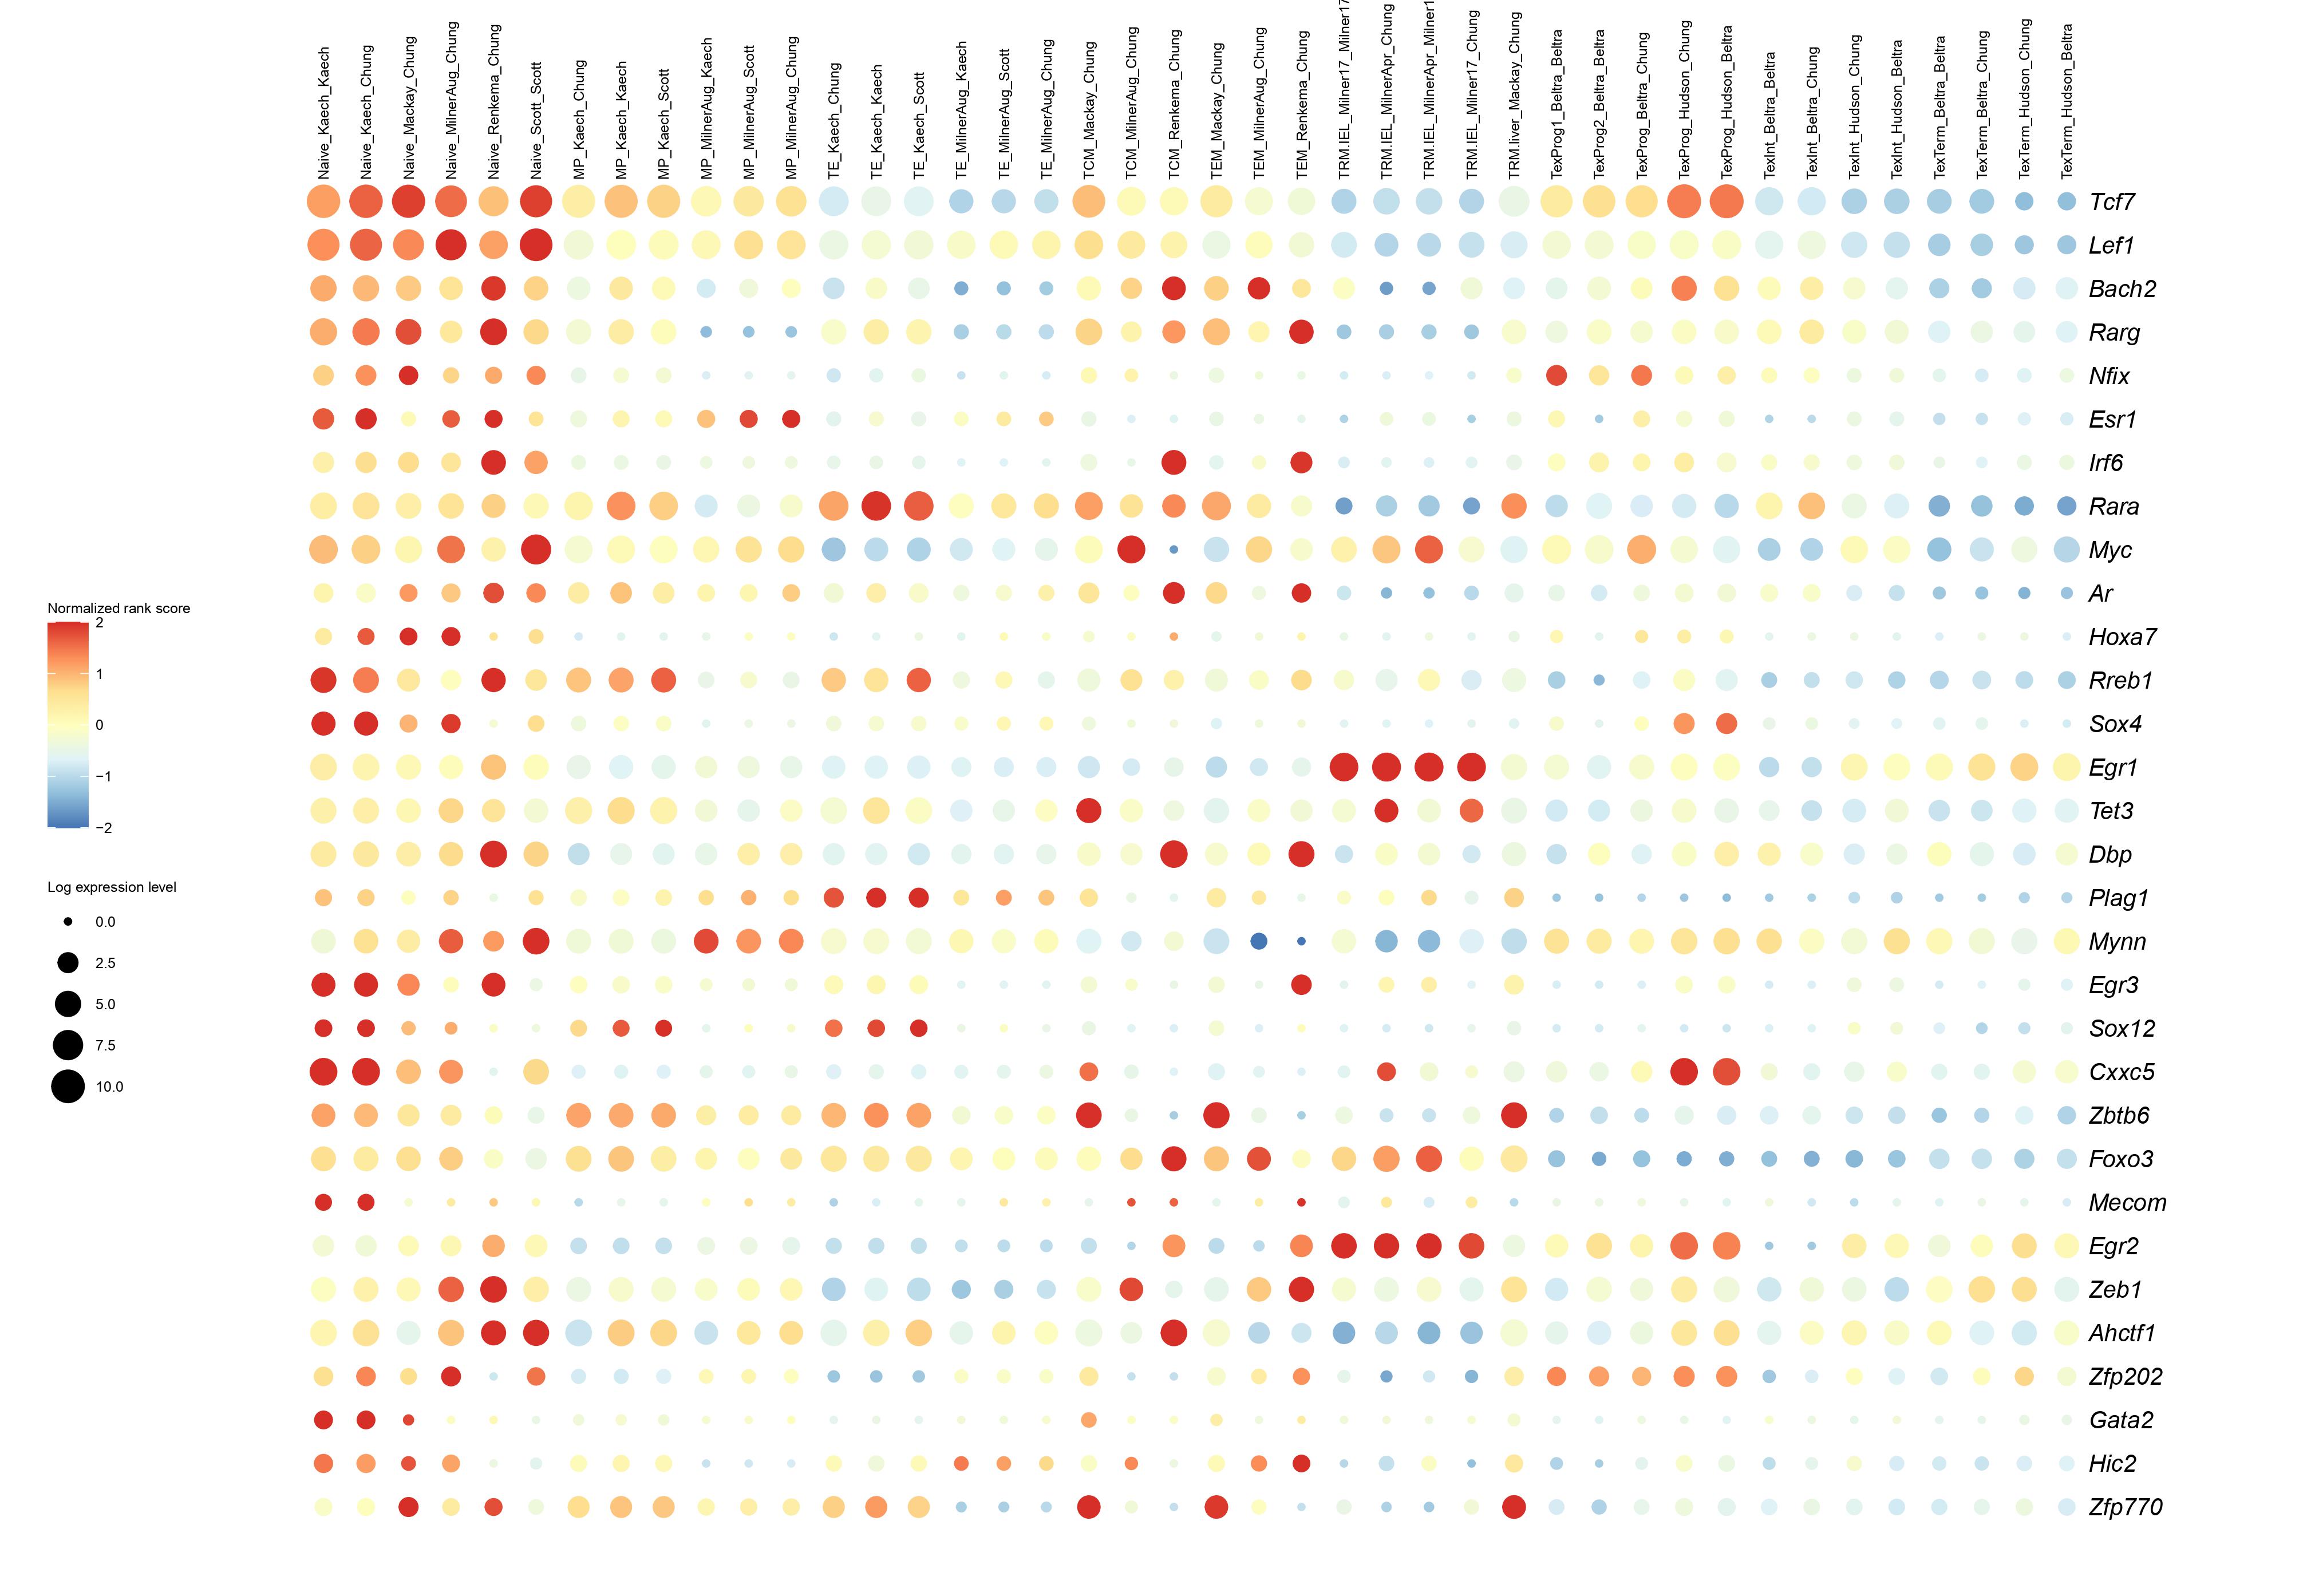
TF score: normalized PageRank scores across samples. Higher scores mean higher activity. TF score takes account of TF expression level, ATAC-seq peak intensity, and motif binding affinity. A TF needs to have both open chromatin regions and gene expression of its downstream genes to have high PageRank scores. For the detailed information of how TF scores are calculated, visit the link: https://taiji-pipeline.github.io/algorithm_PageRank.html
Cell-state specificity: significantly higher TF score in specific cell state. For example, 'TEXterm' means TF has significantly higher TF score in TEXterm. 'ALL' means no cell-state specificity.
Sample name nomenclature: cell state abbreviation + first author of RNA dataset + first author of ATAC dataset. If the same author has multiple datasets, then publication year and month is used. For example: 'Milner17' means Milner paper published in 2017; 'MilnerApr' means Milner paper published in April.
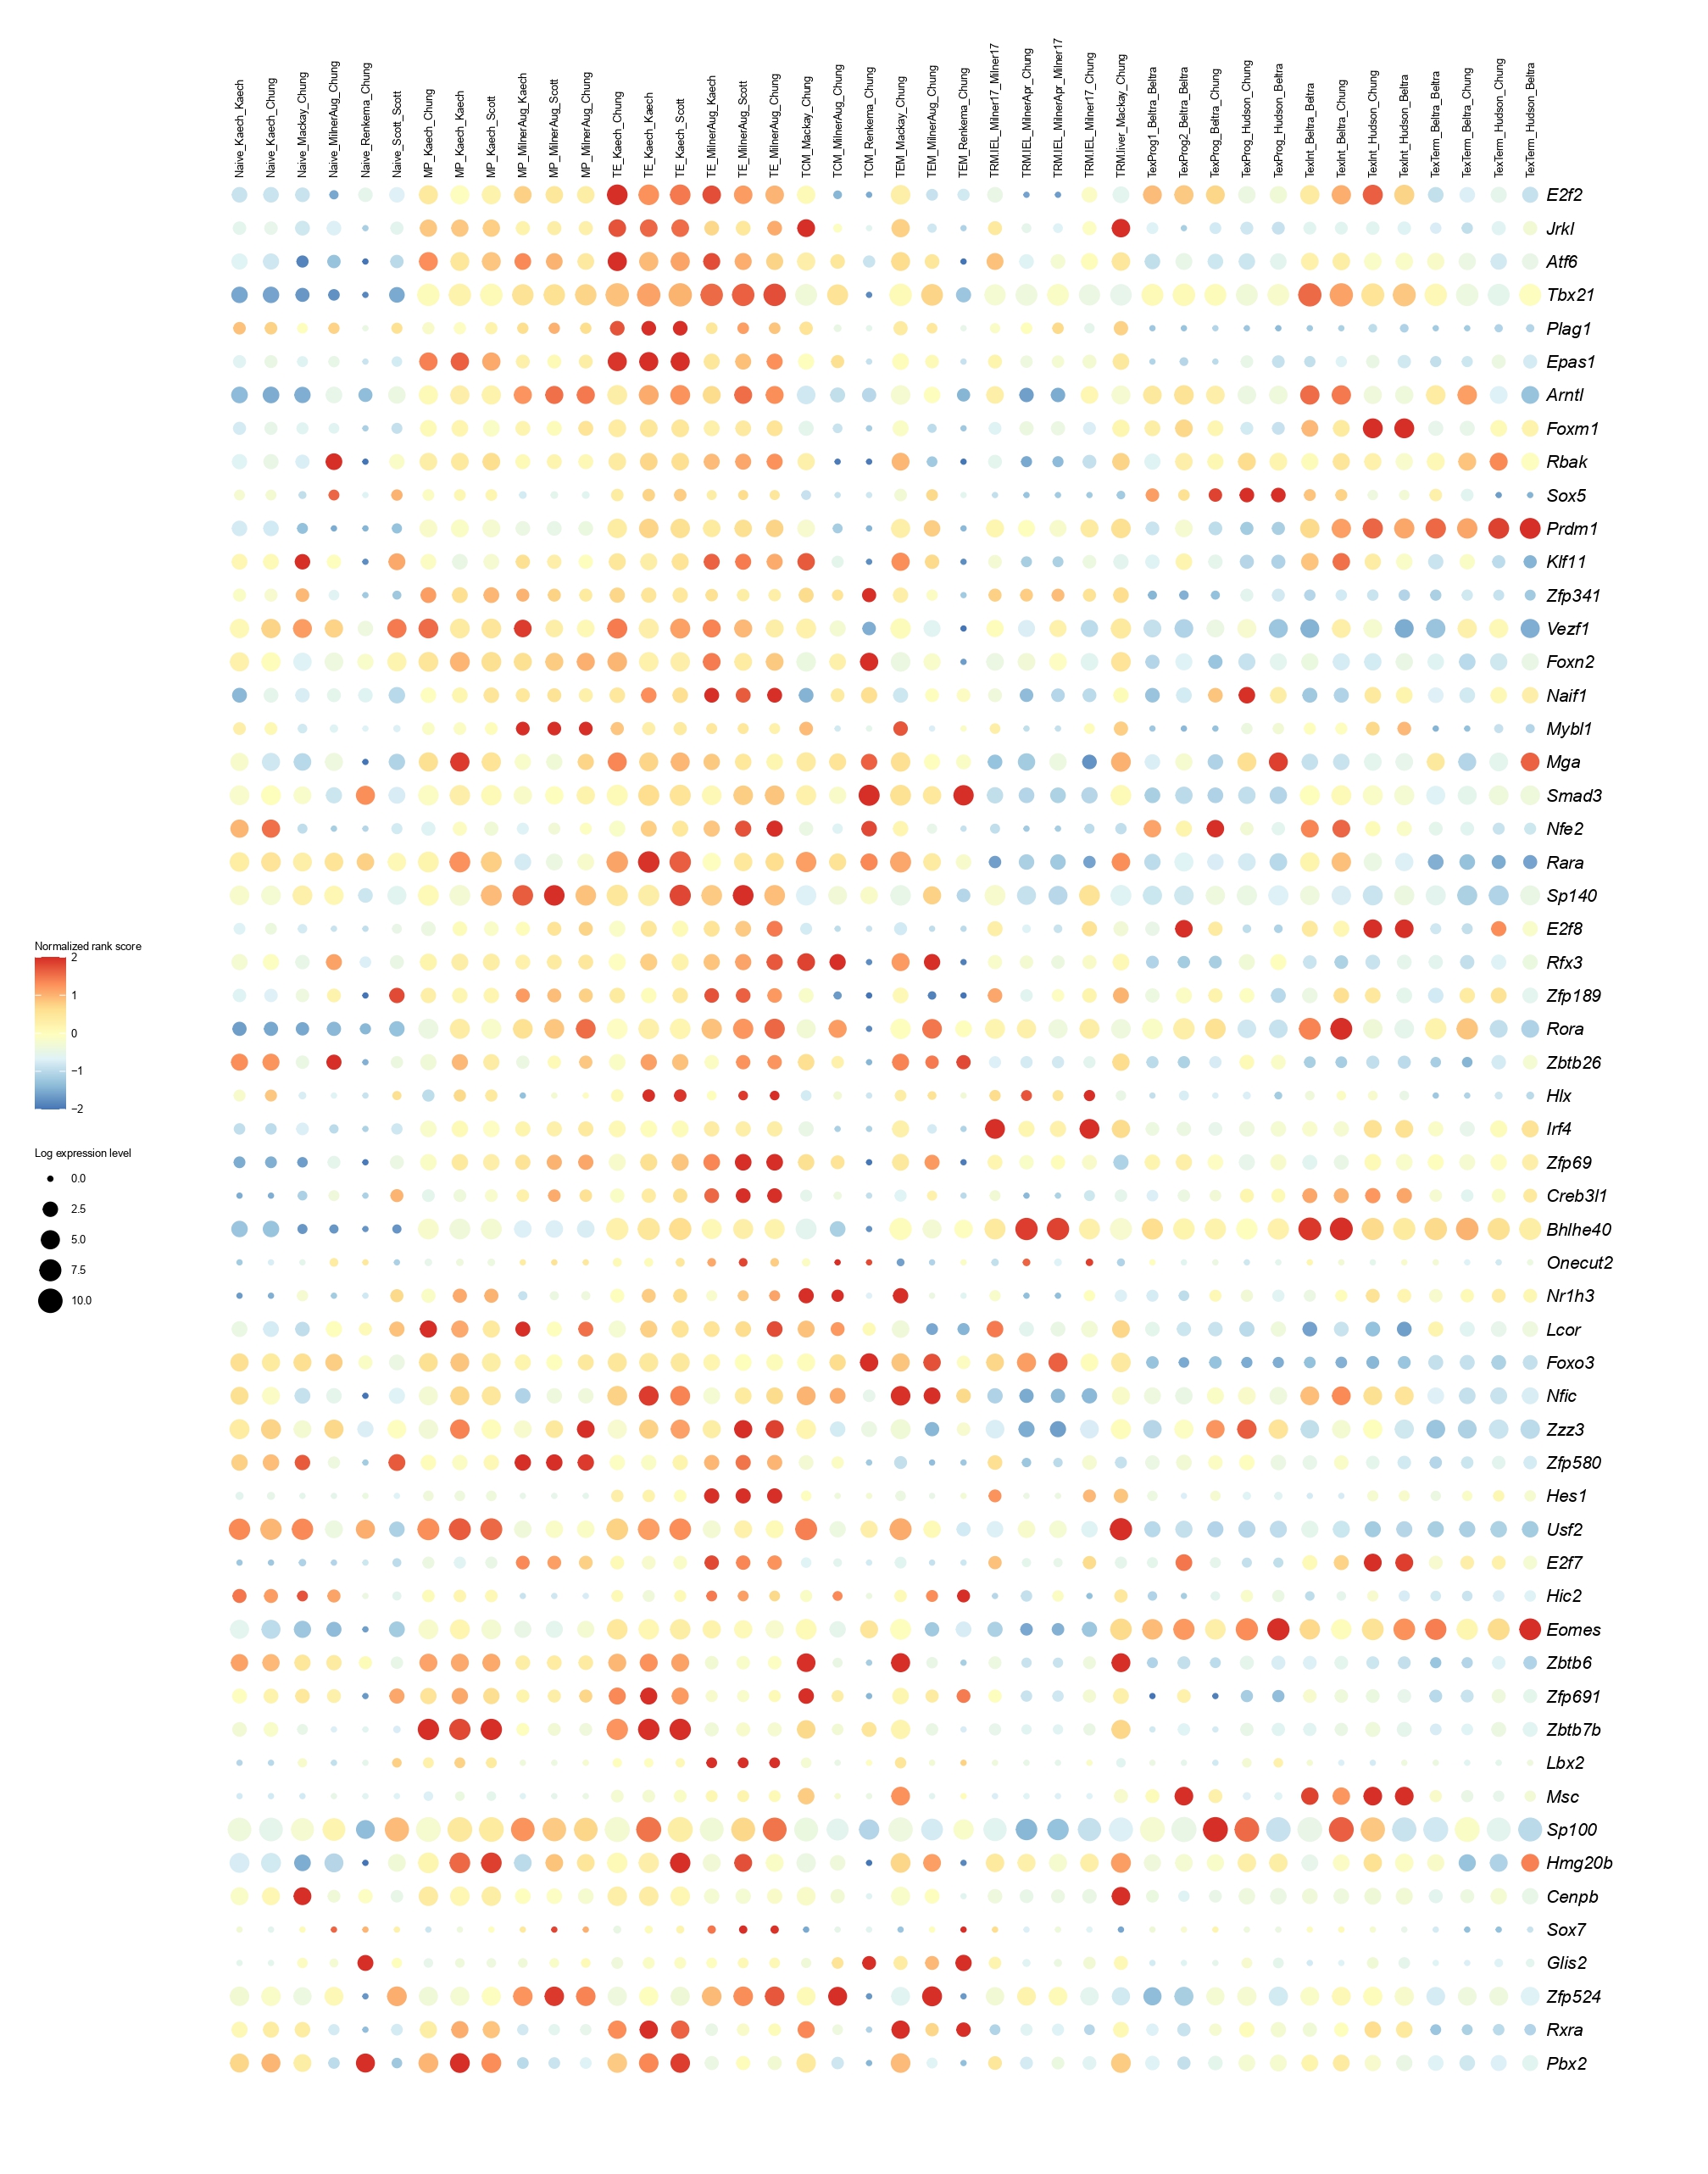
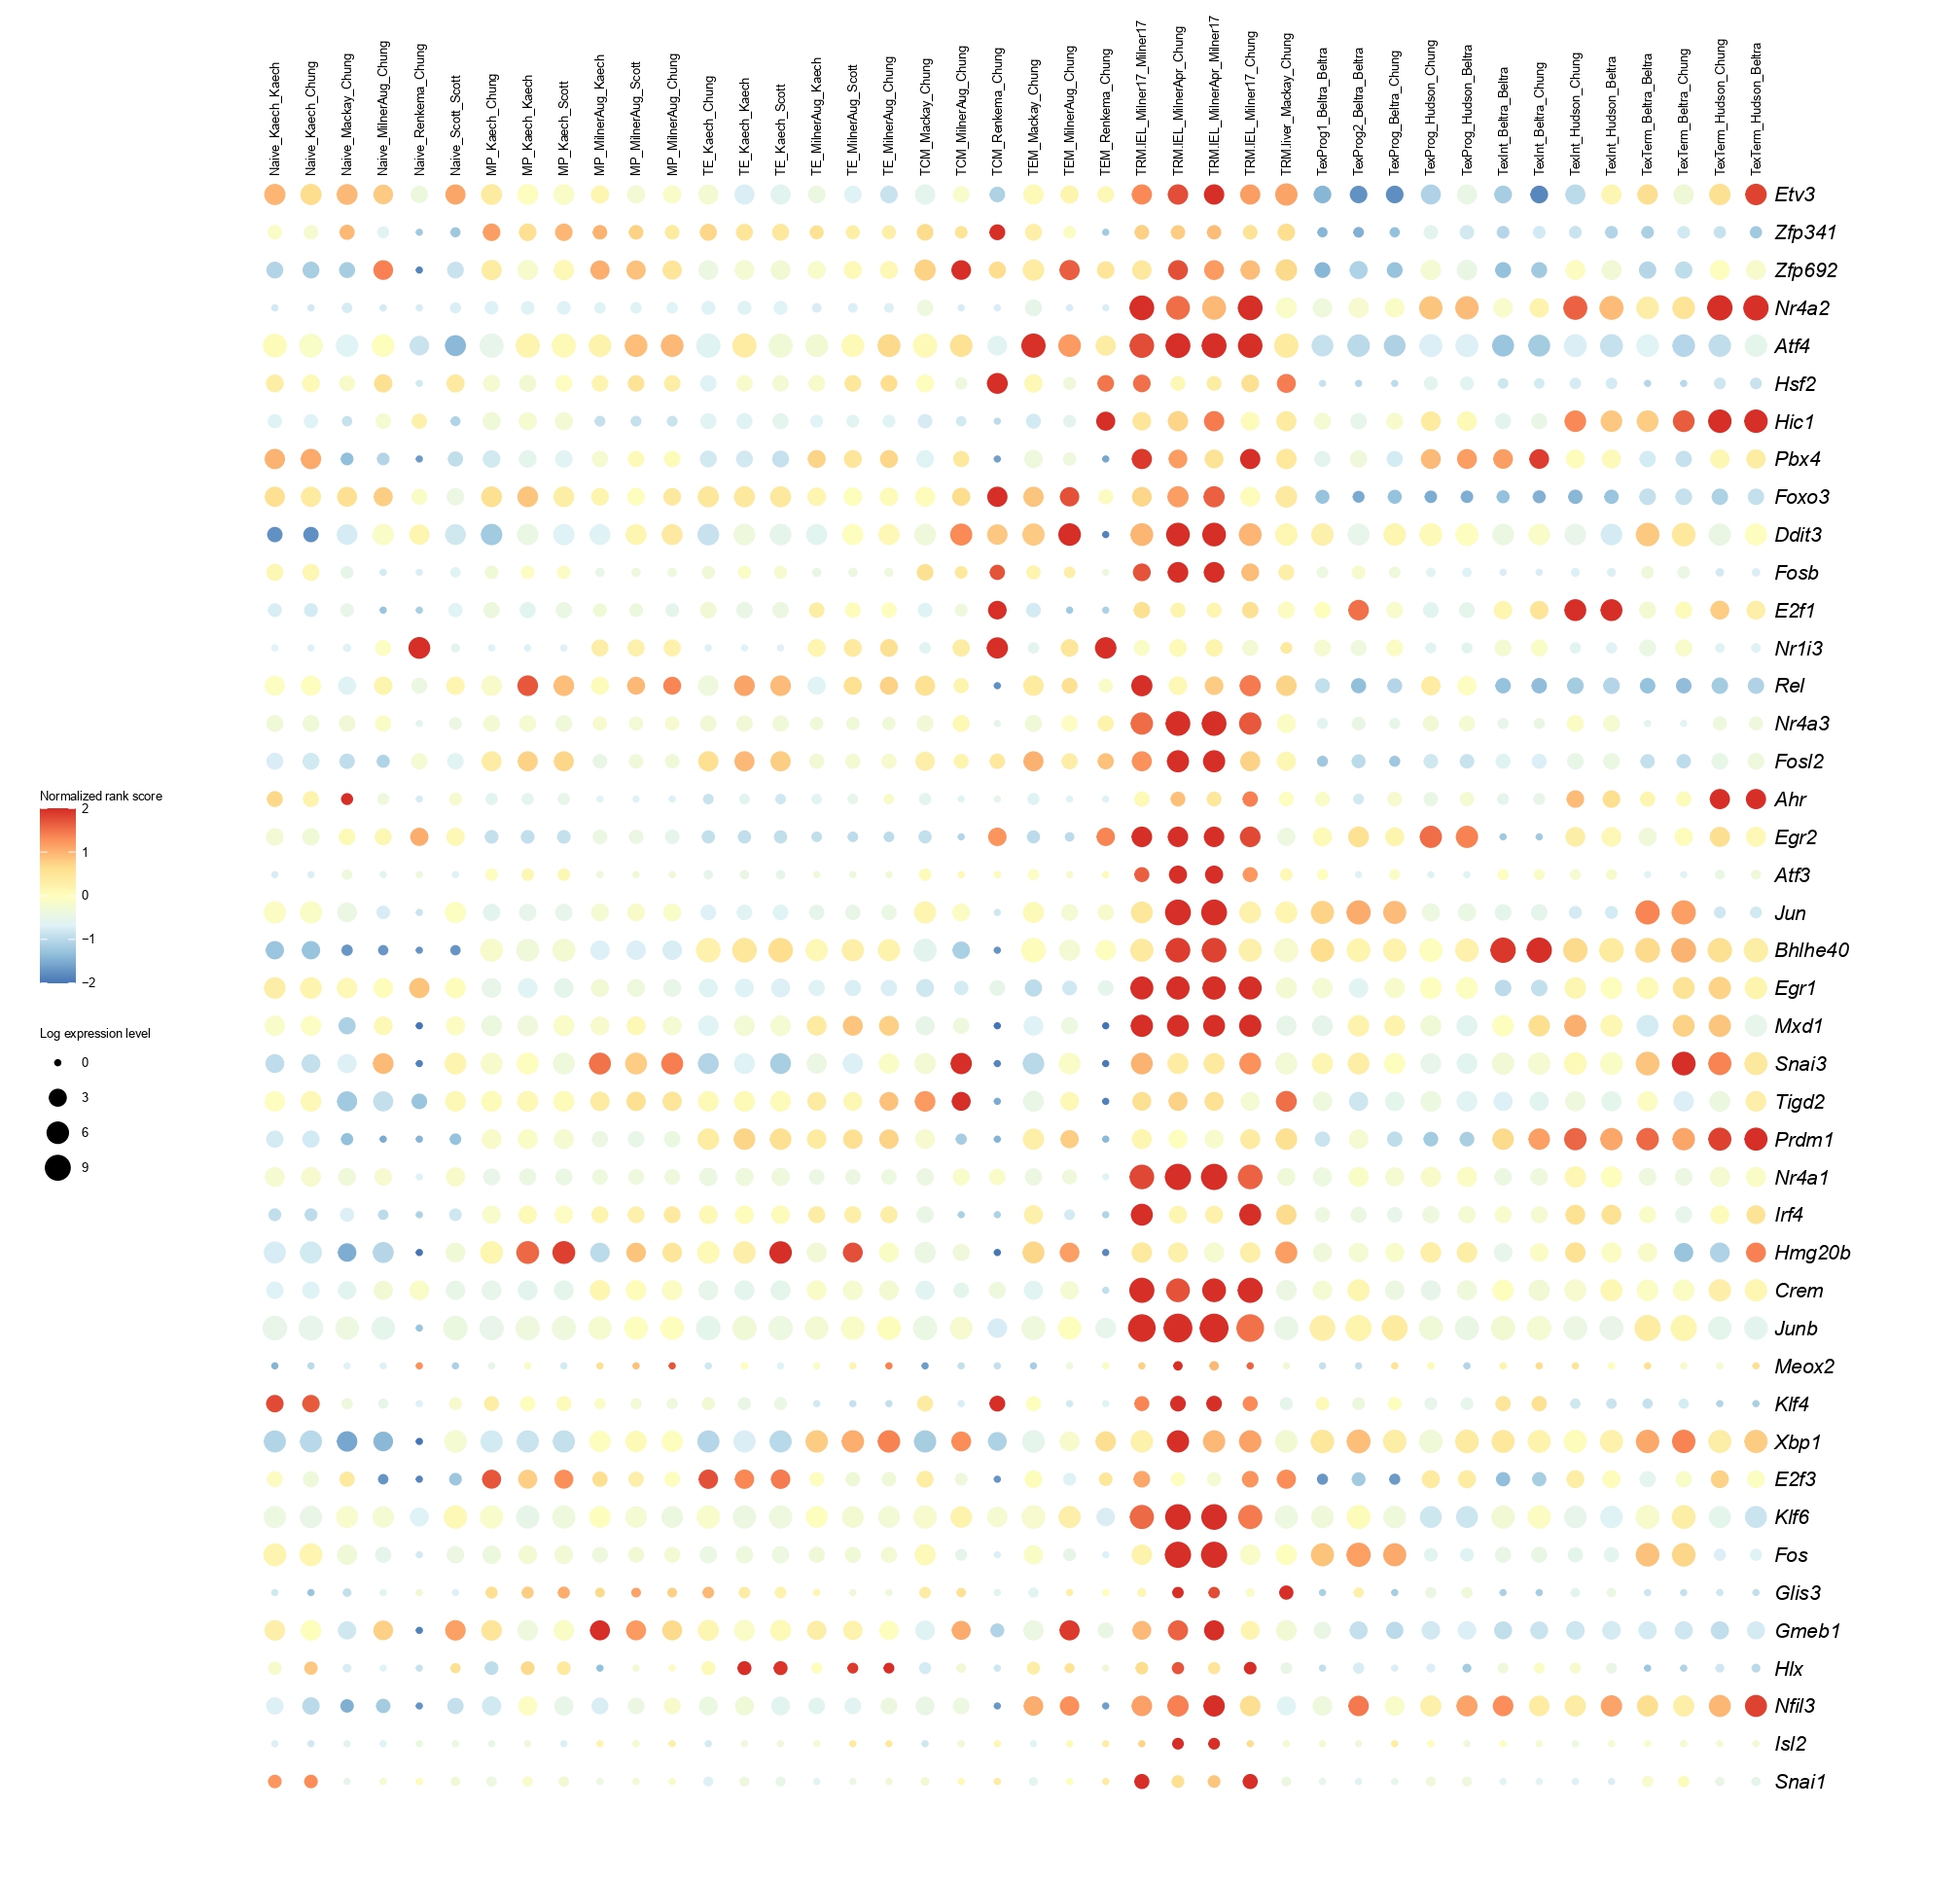
Below you will find the bubble plot and a searchable excel file containing all the normalized TF activity scores
Circle size represents the logarithm of gene expression, and the color represents the normalized PageRank score.
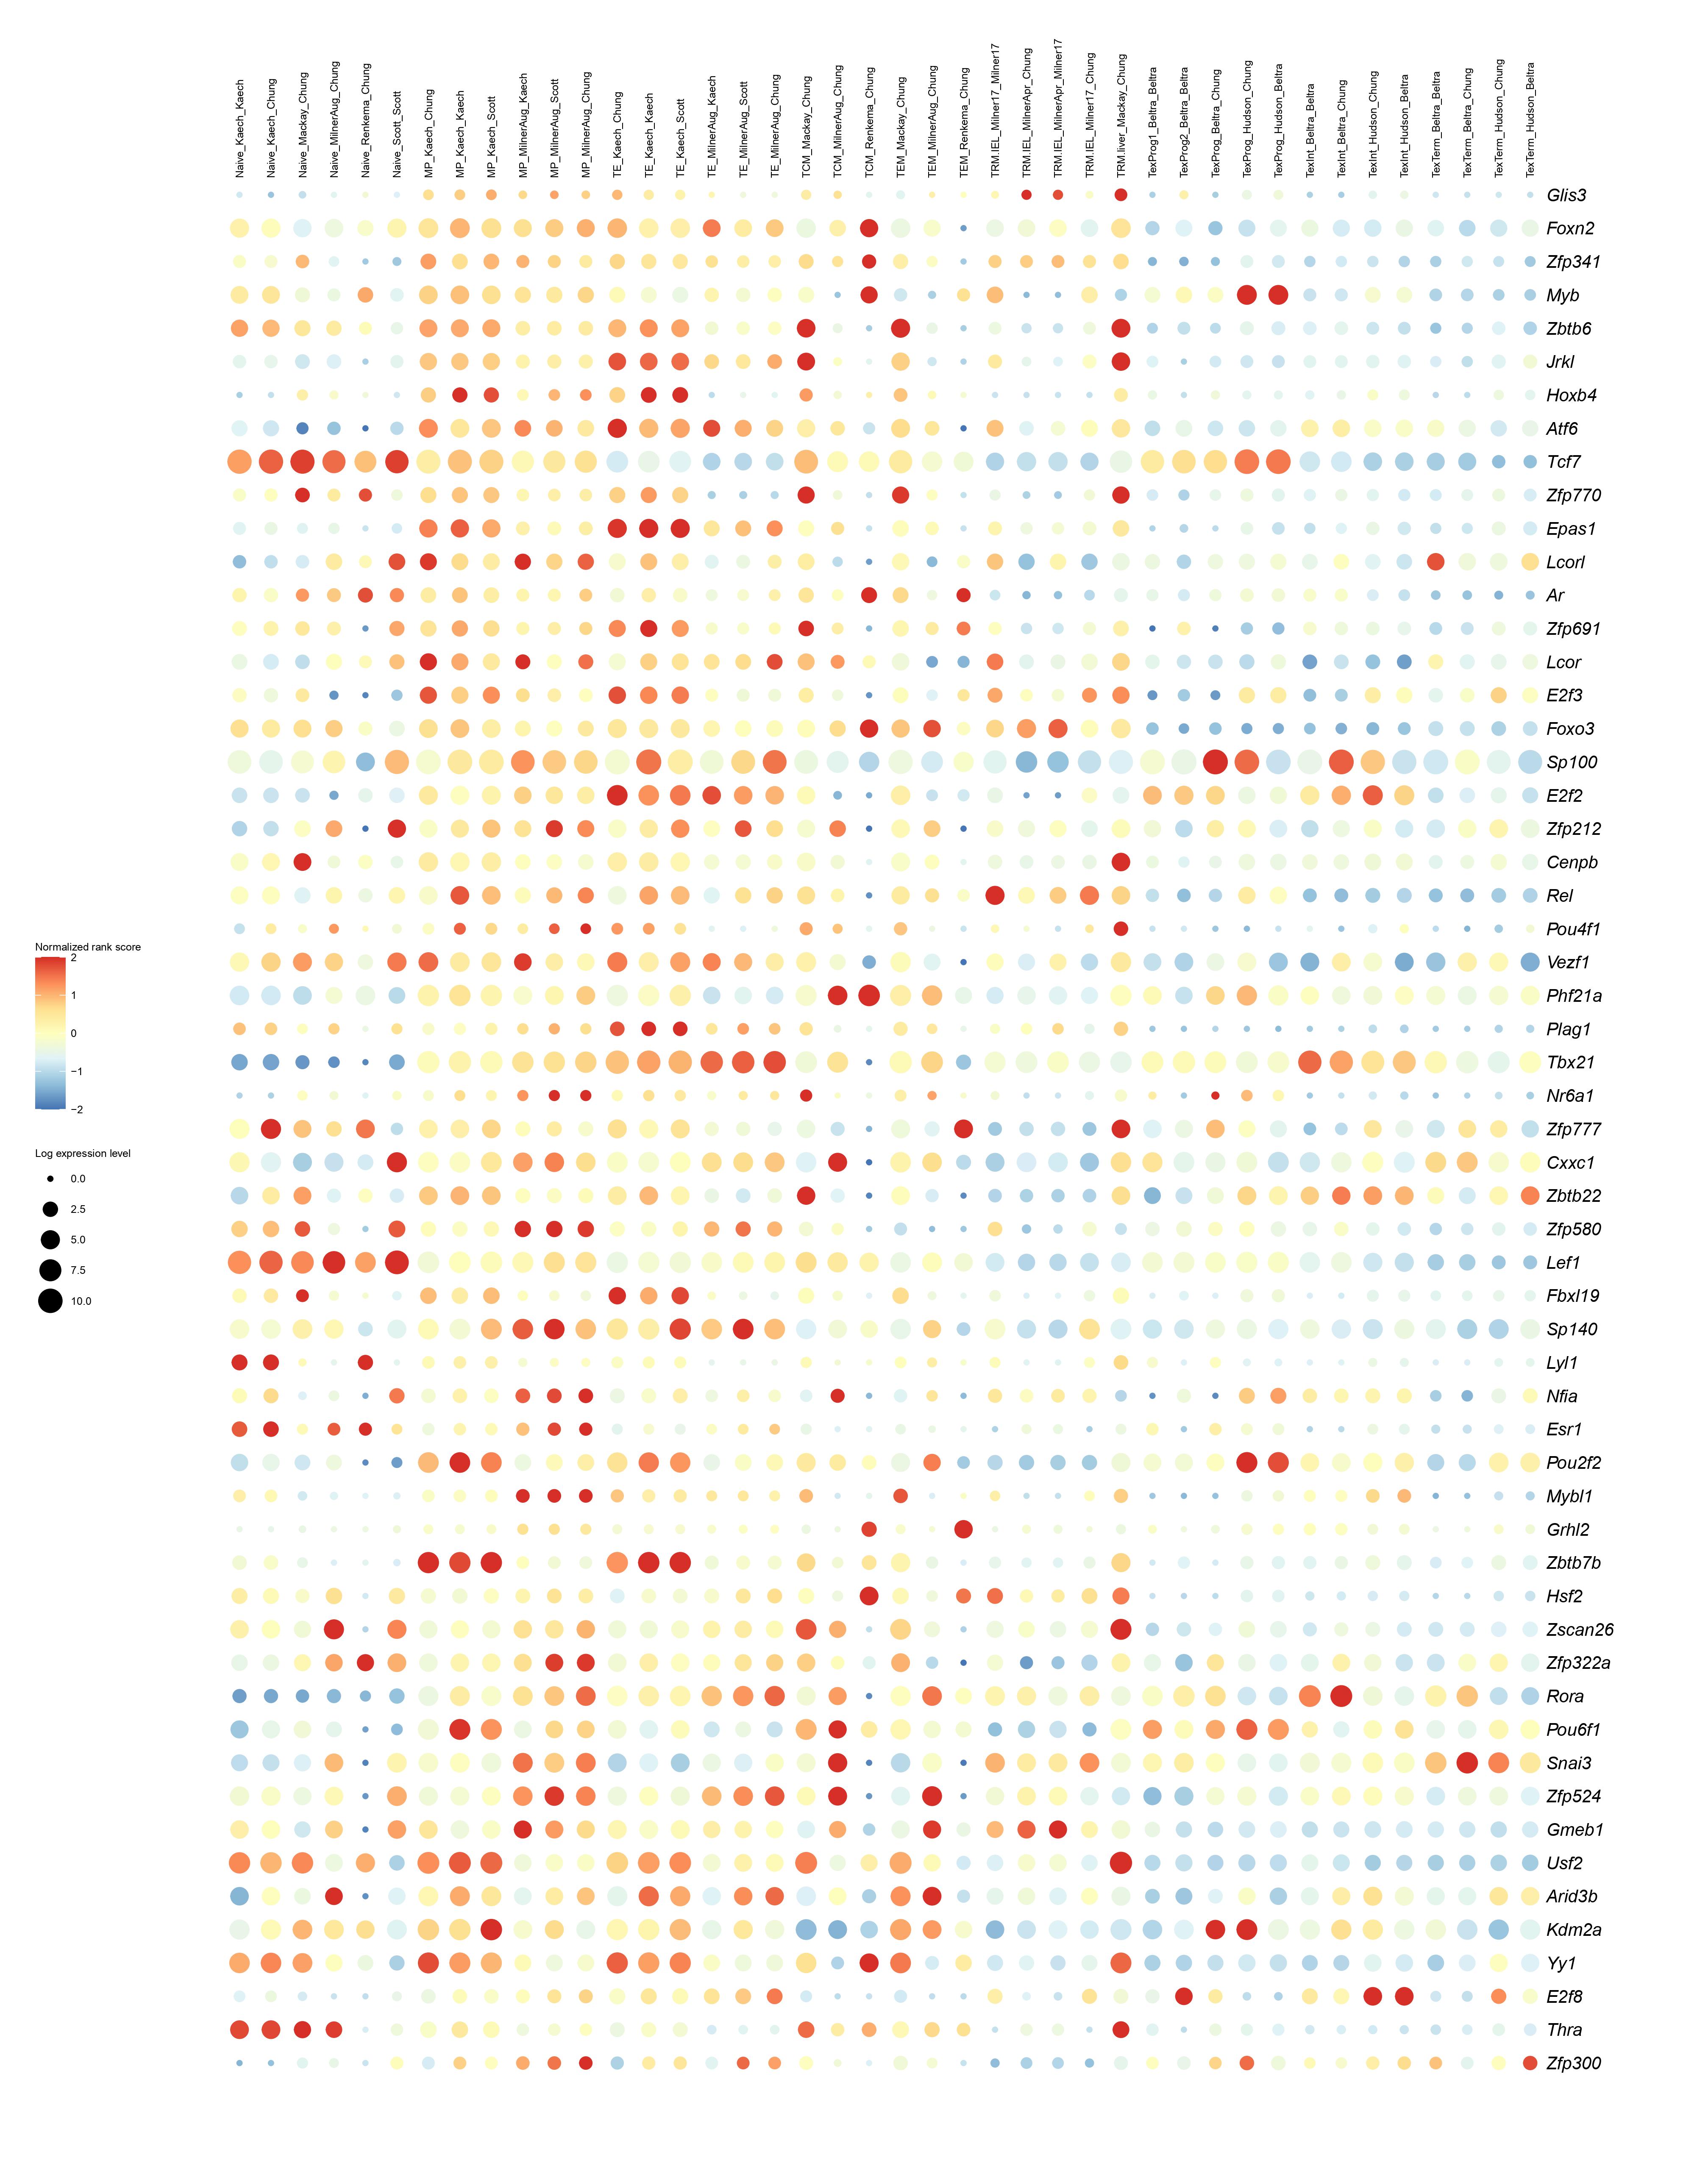
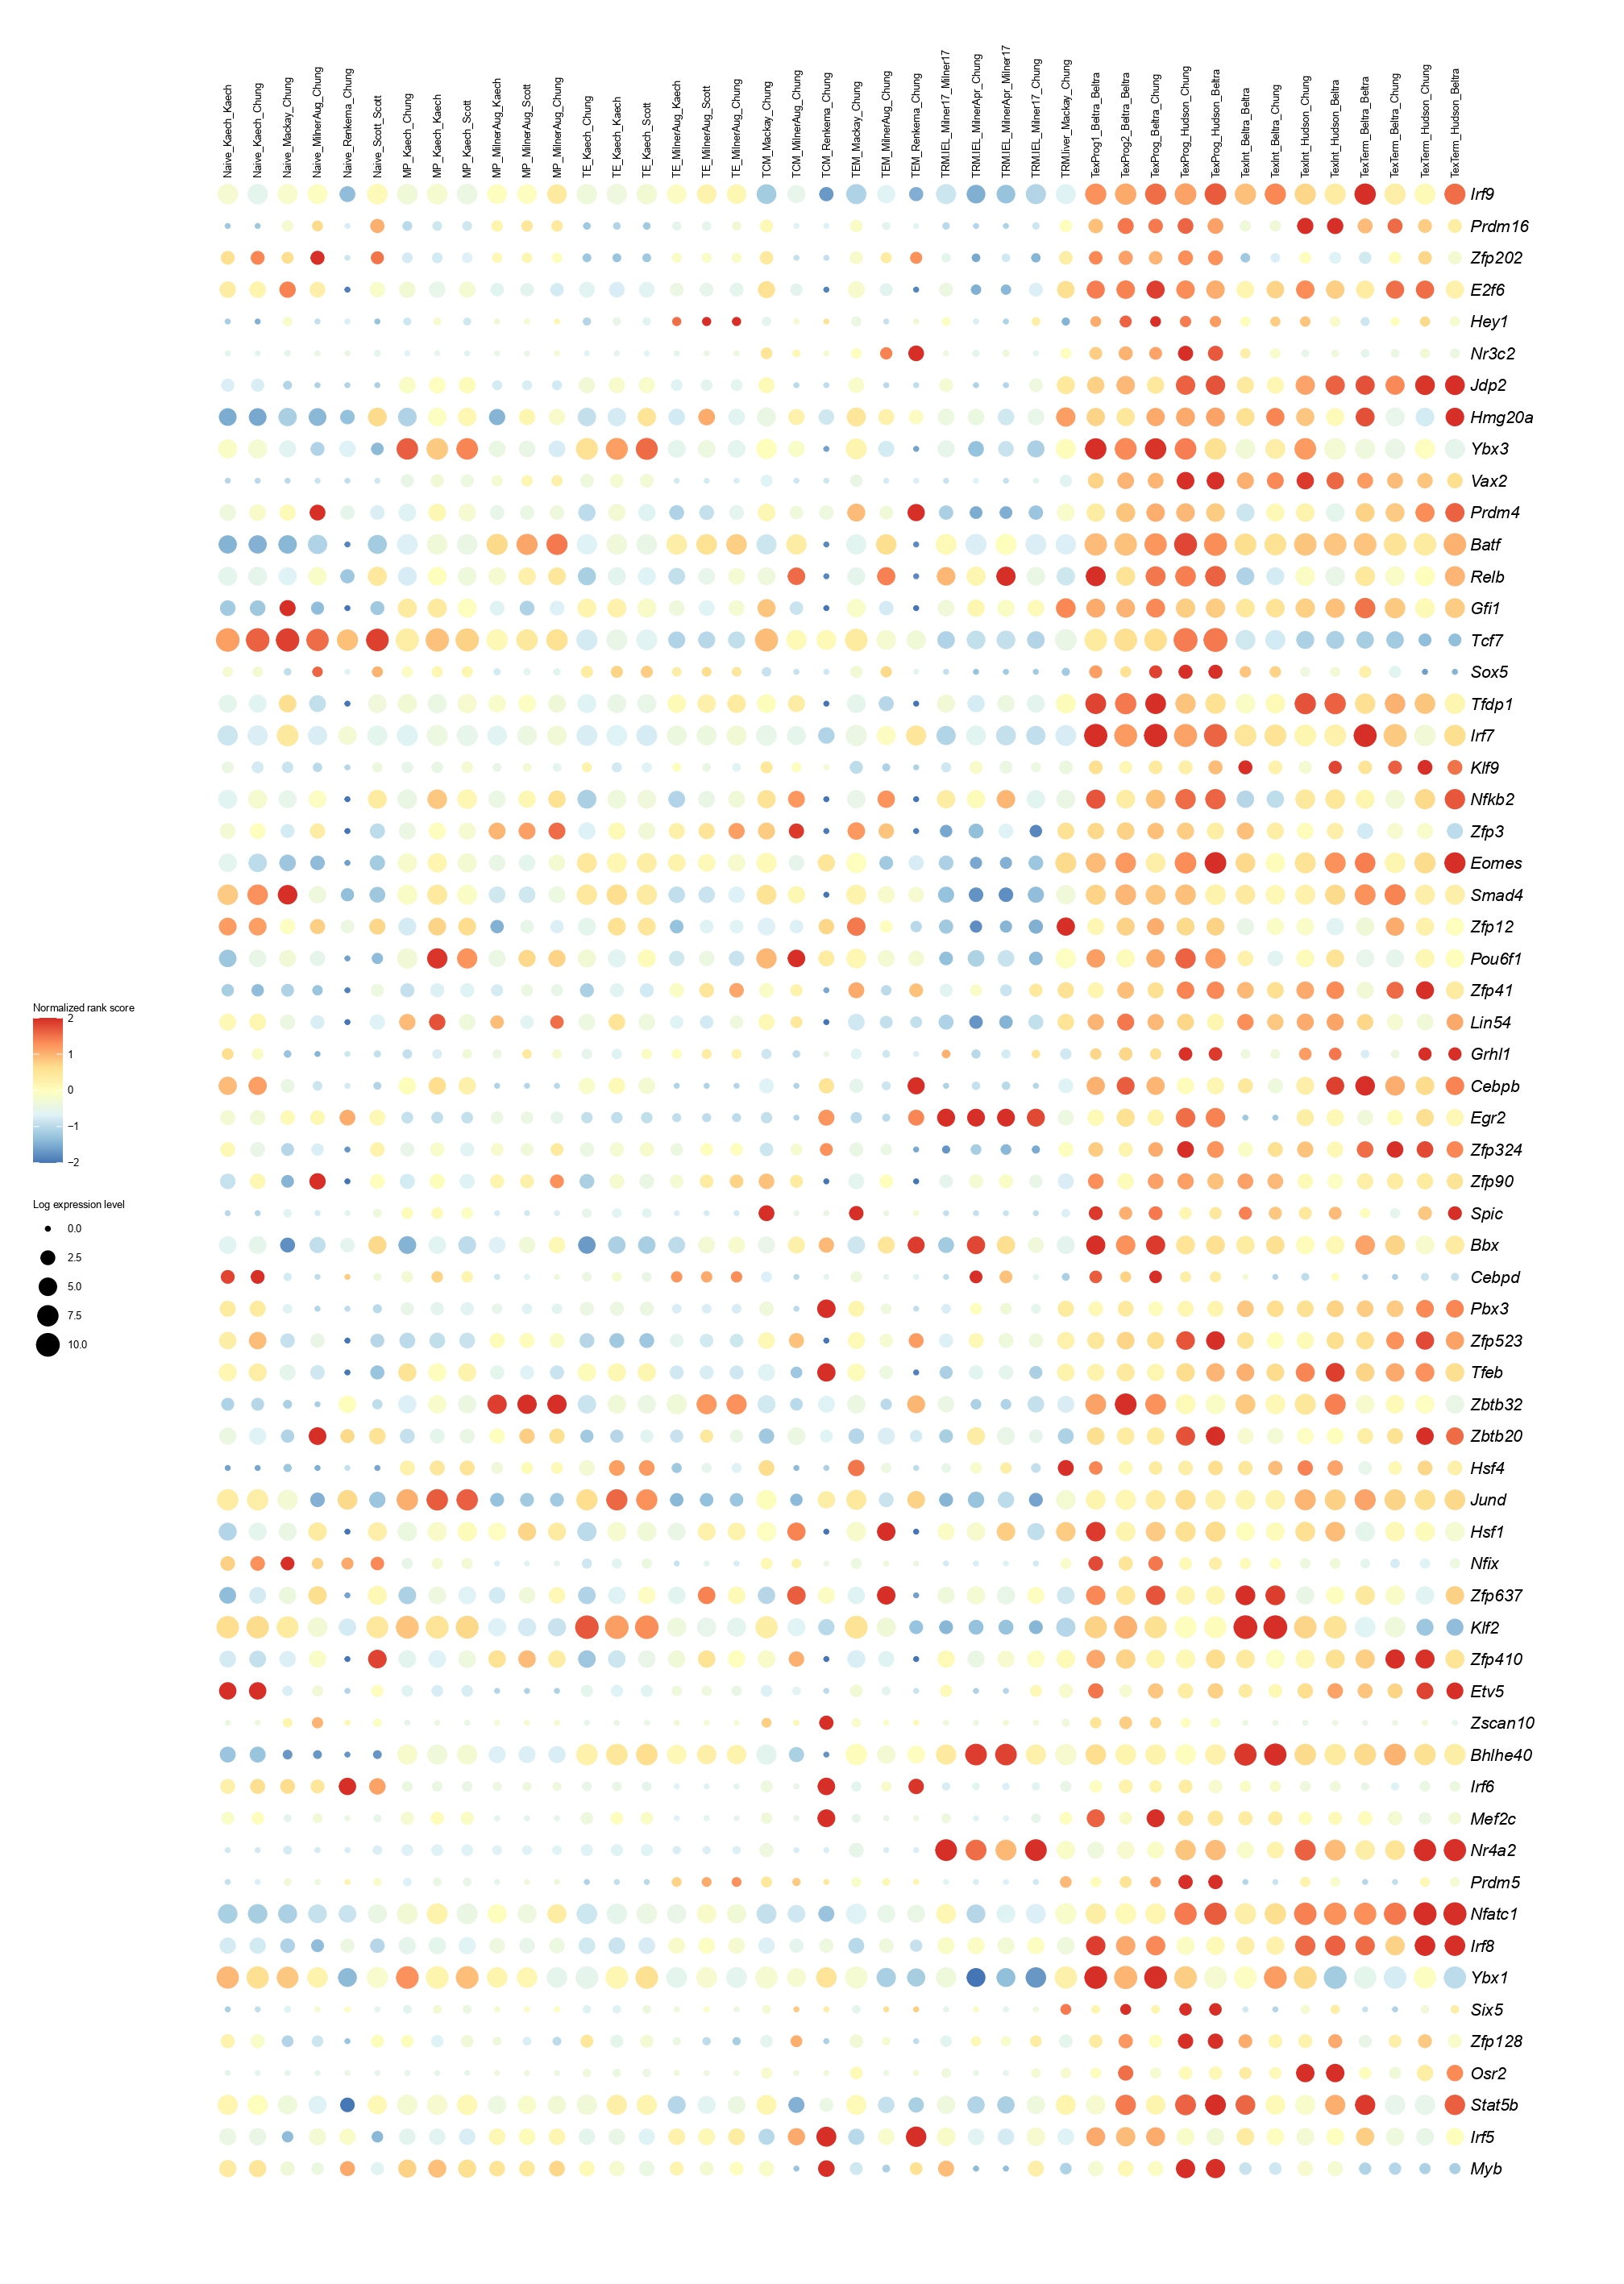
Below you will find the bubble plot and a searchable excel file containing all the normalized TF activity scores
Circle size represents the logarithm of gene expression, and the color represents the normalized PageRank score.
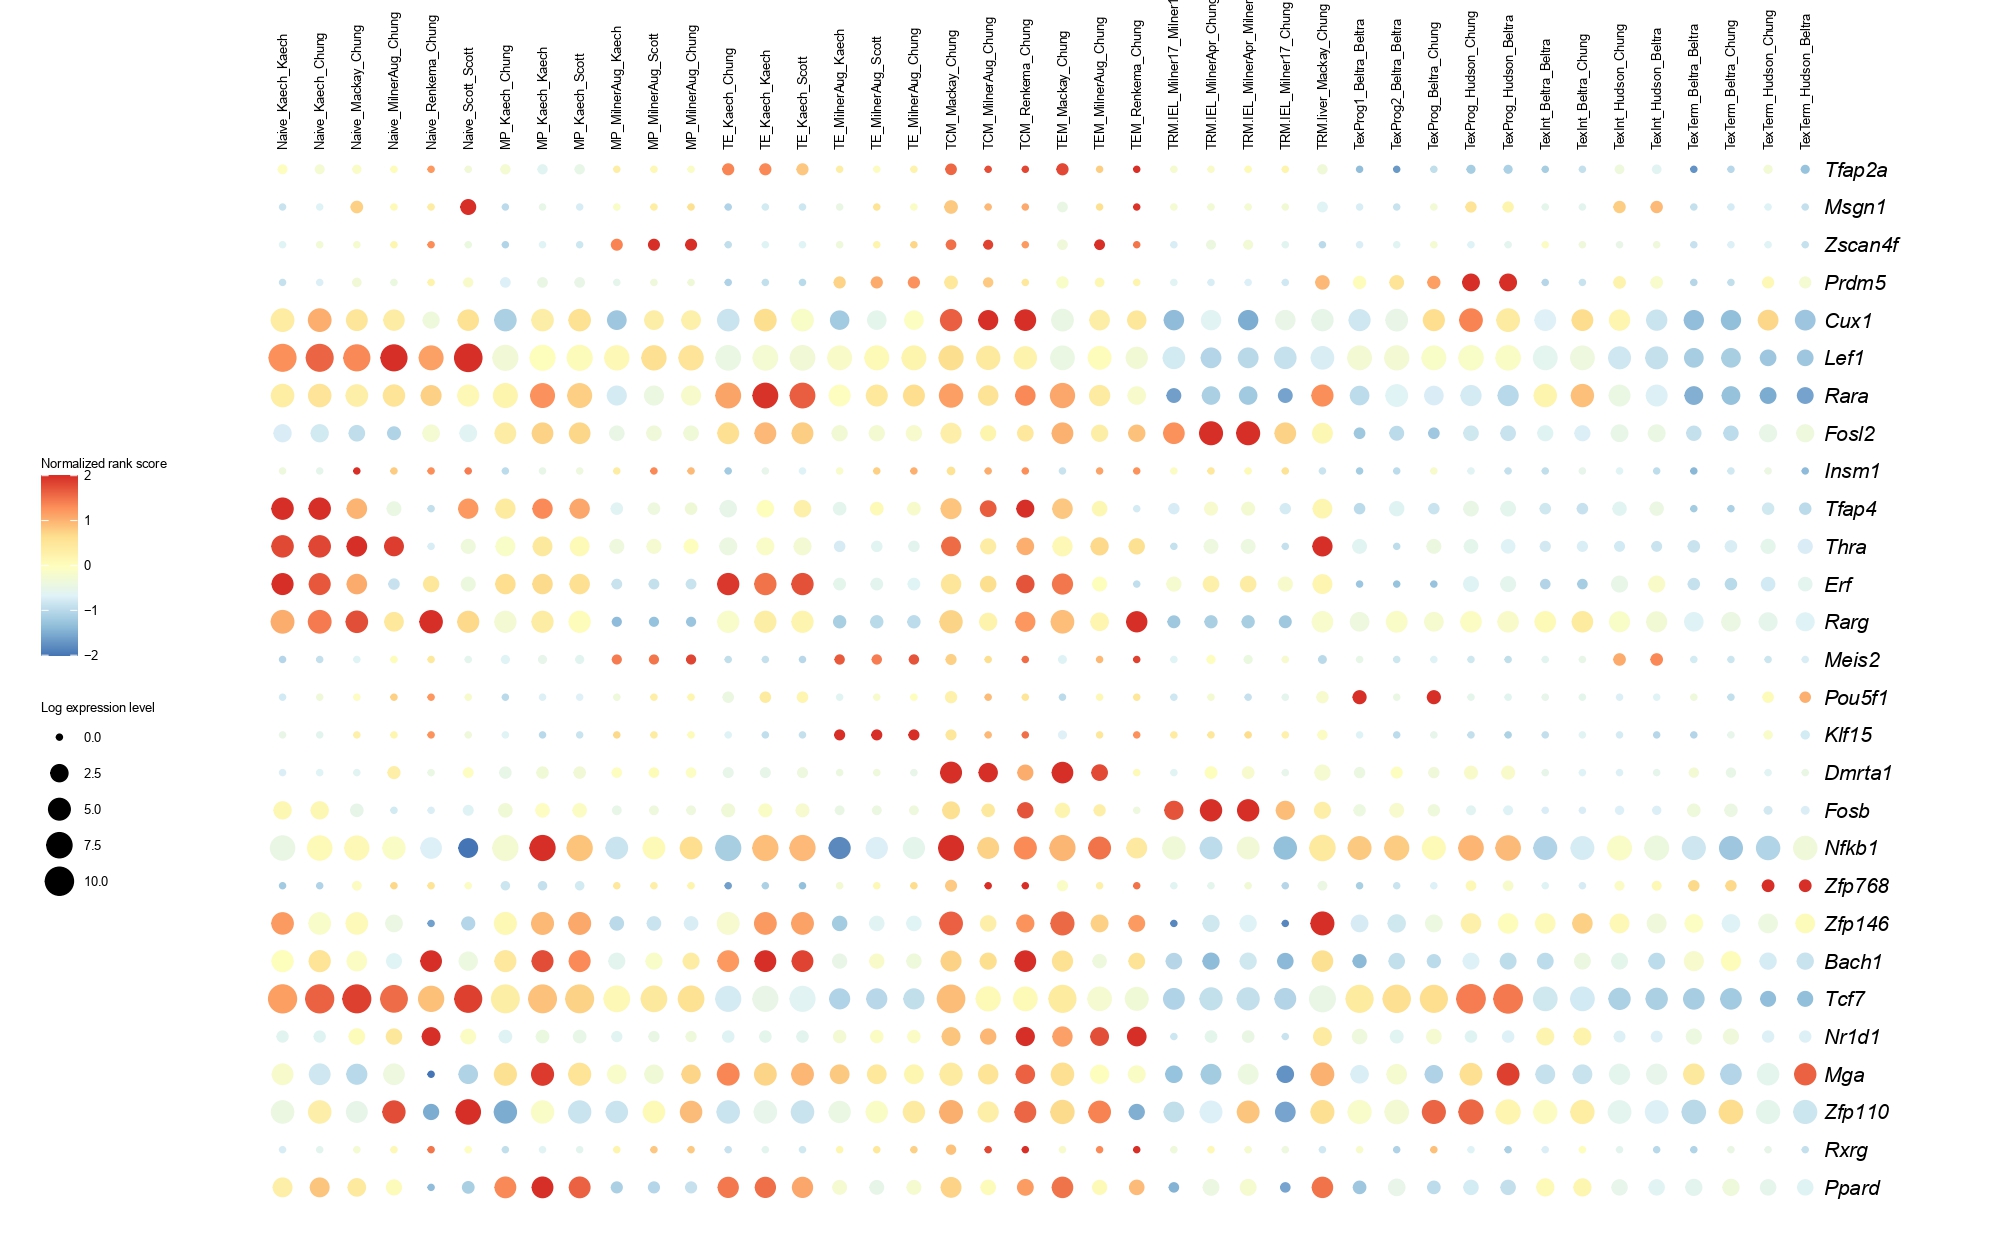
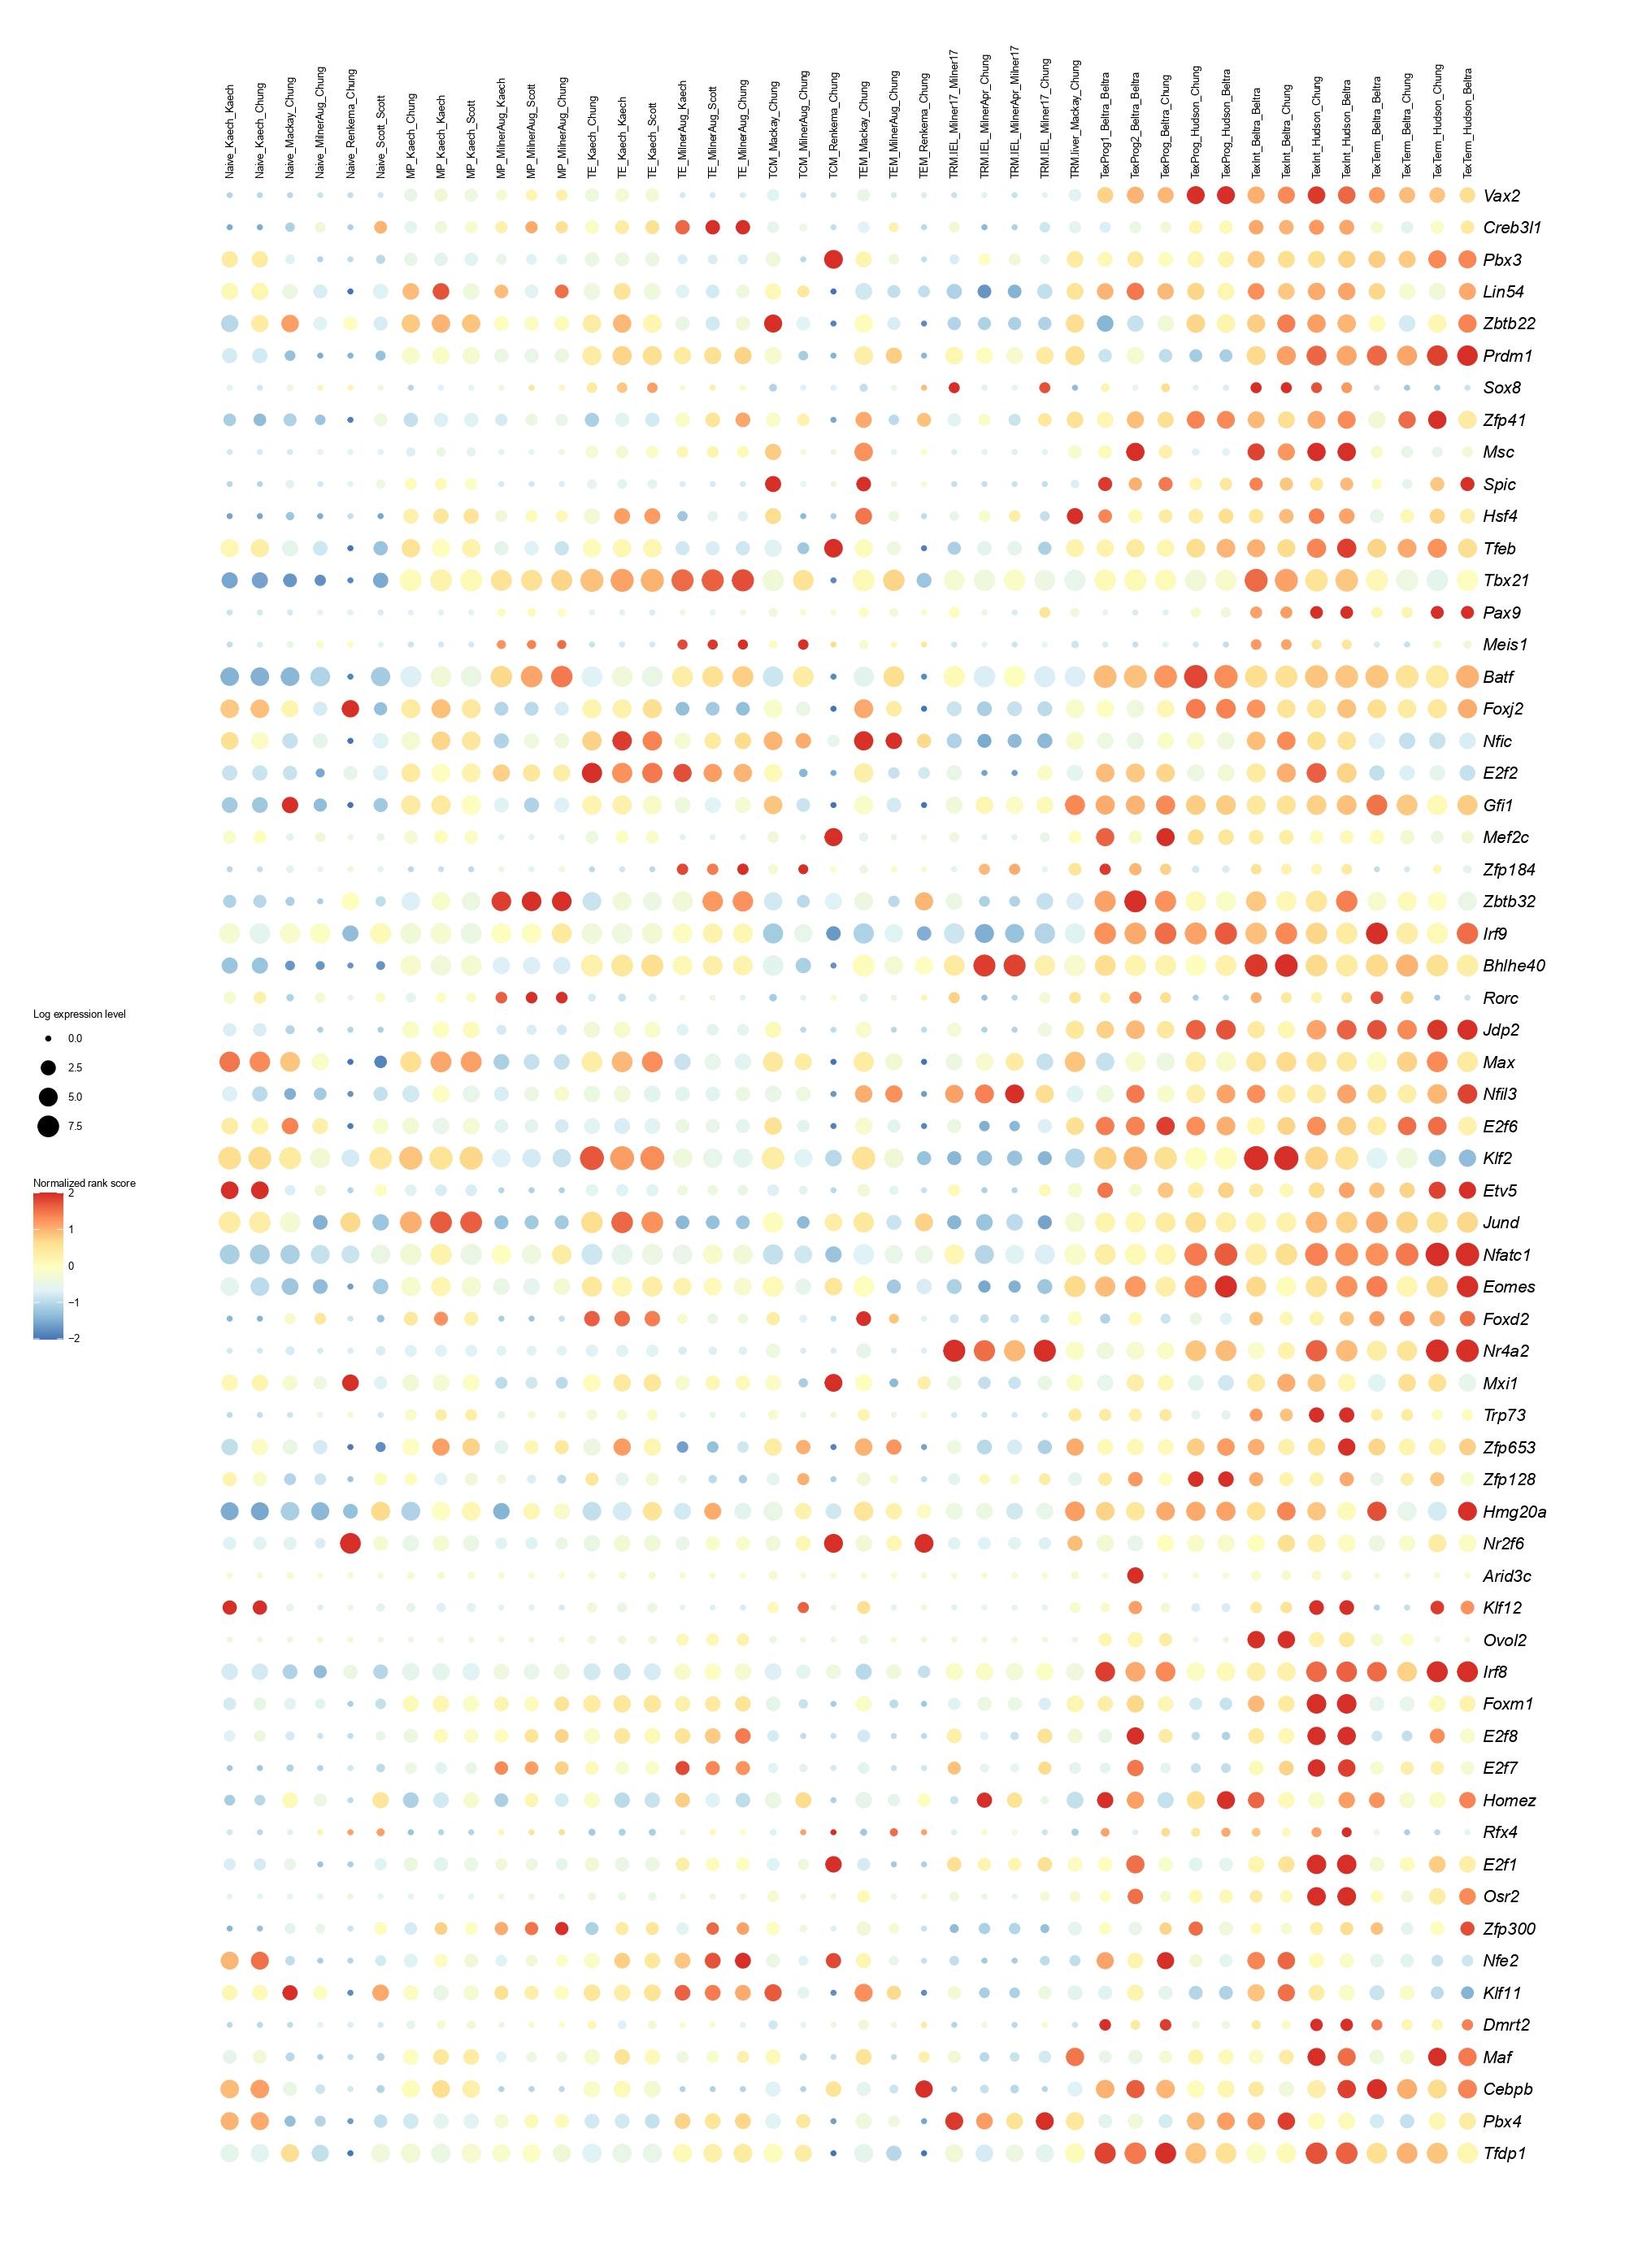
Below you will find the bubble plot and a searchable excel file containing all the normalized TF activity scores
Circle size represents the logarithm of gene expression, and the color represents the normalized PageRank score.
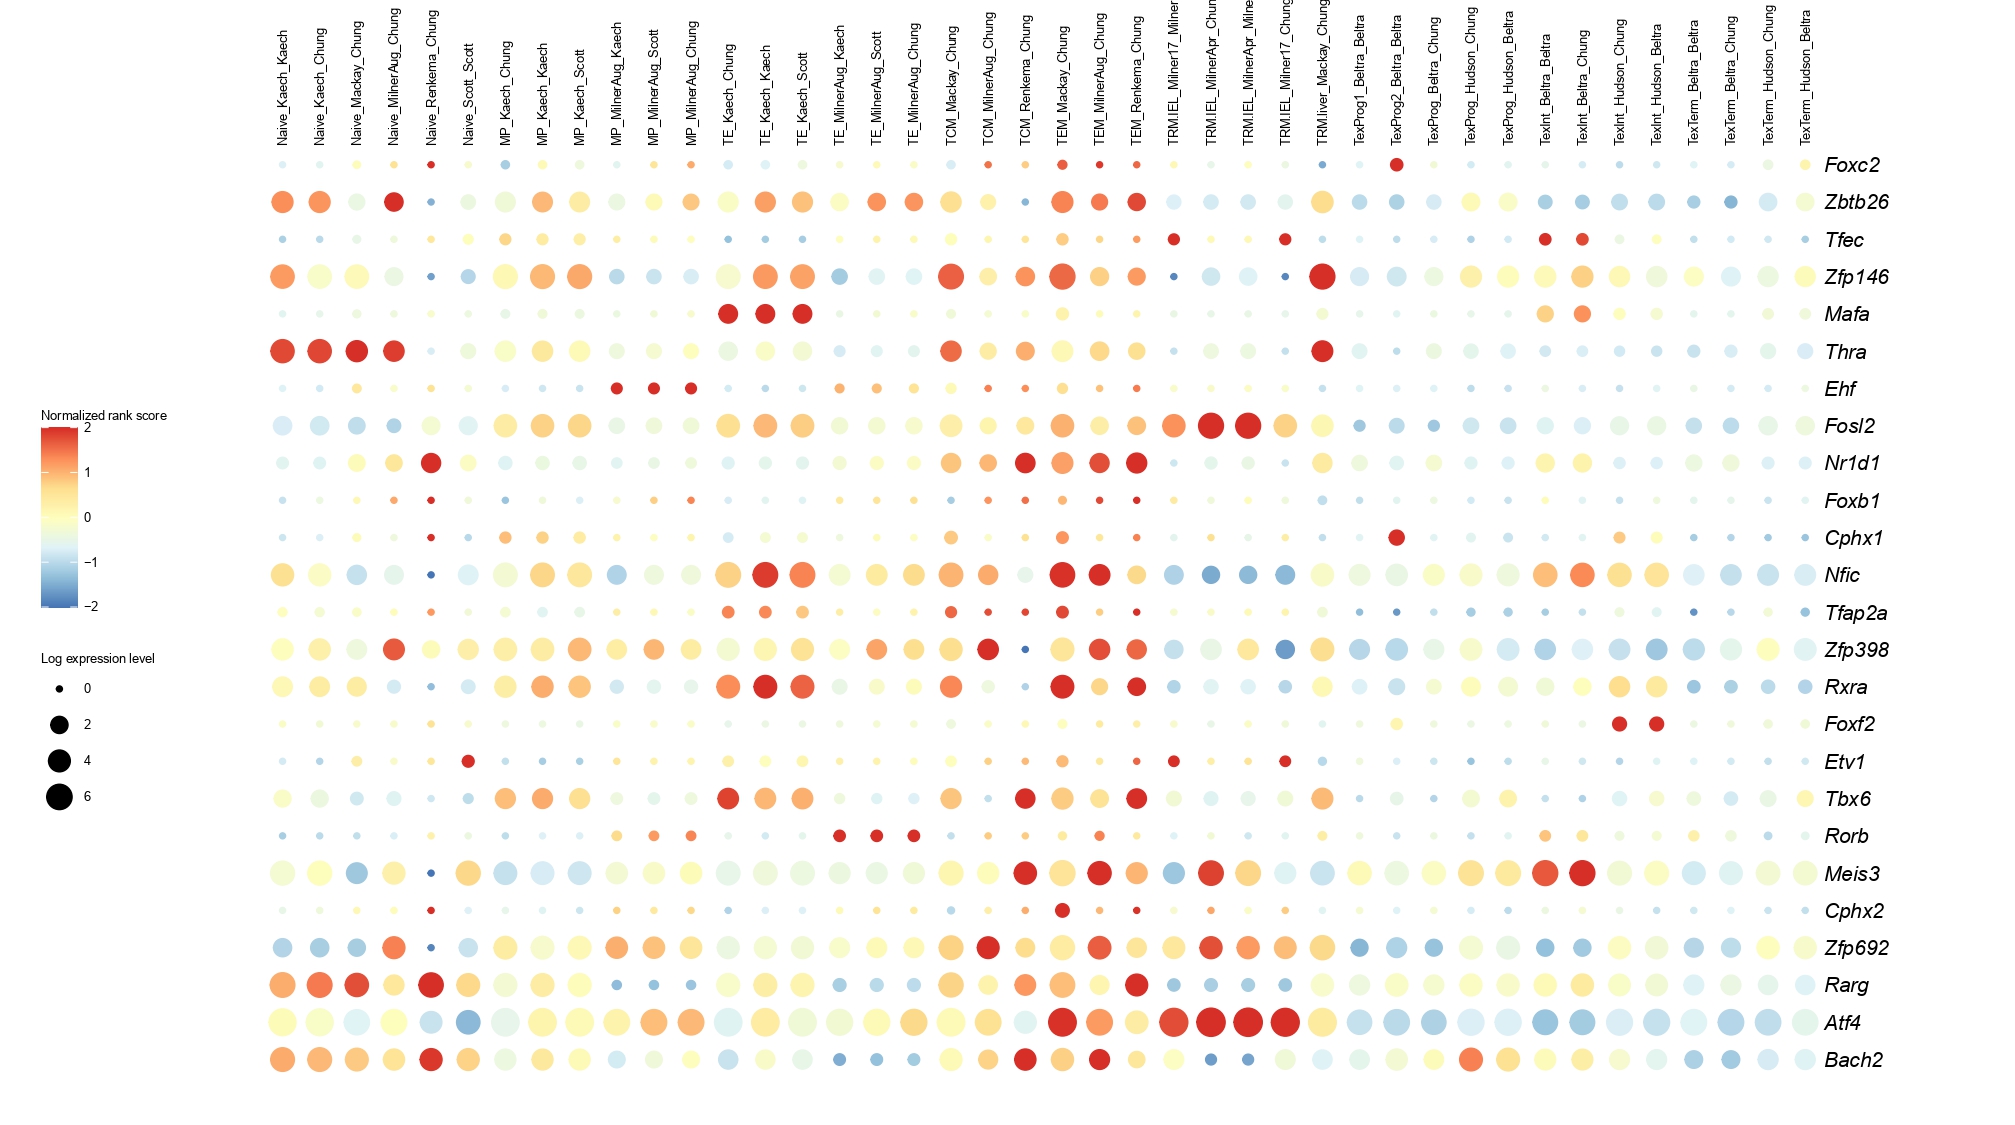
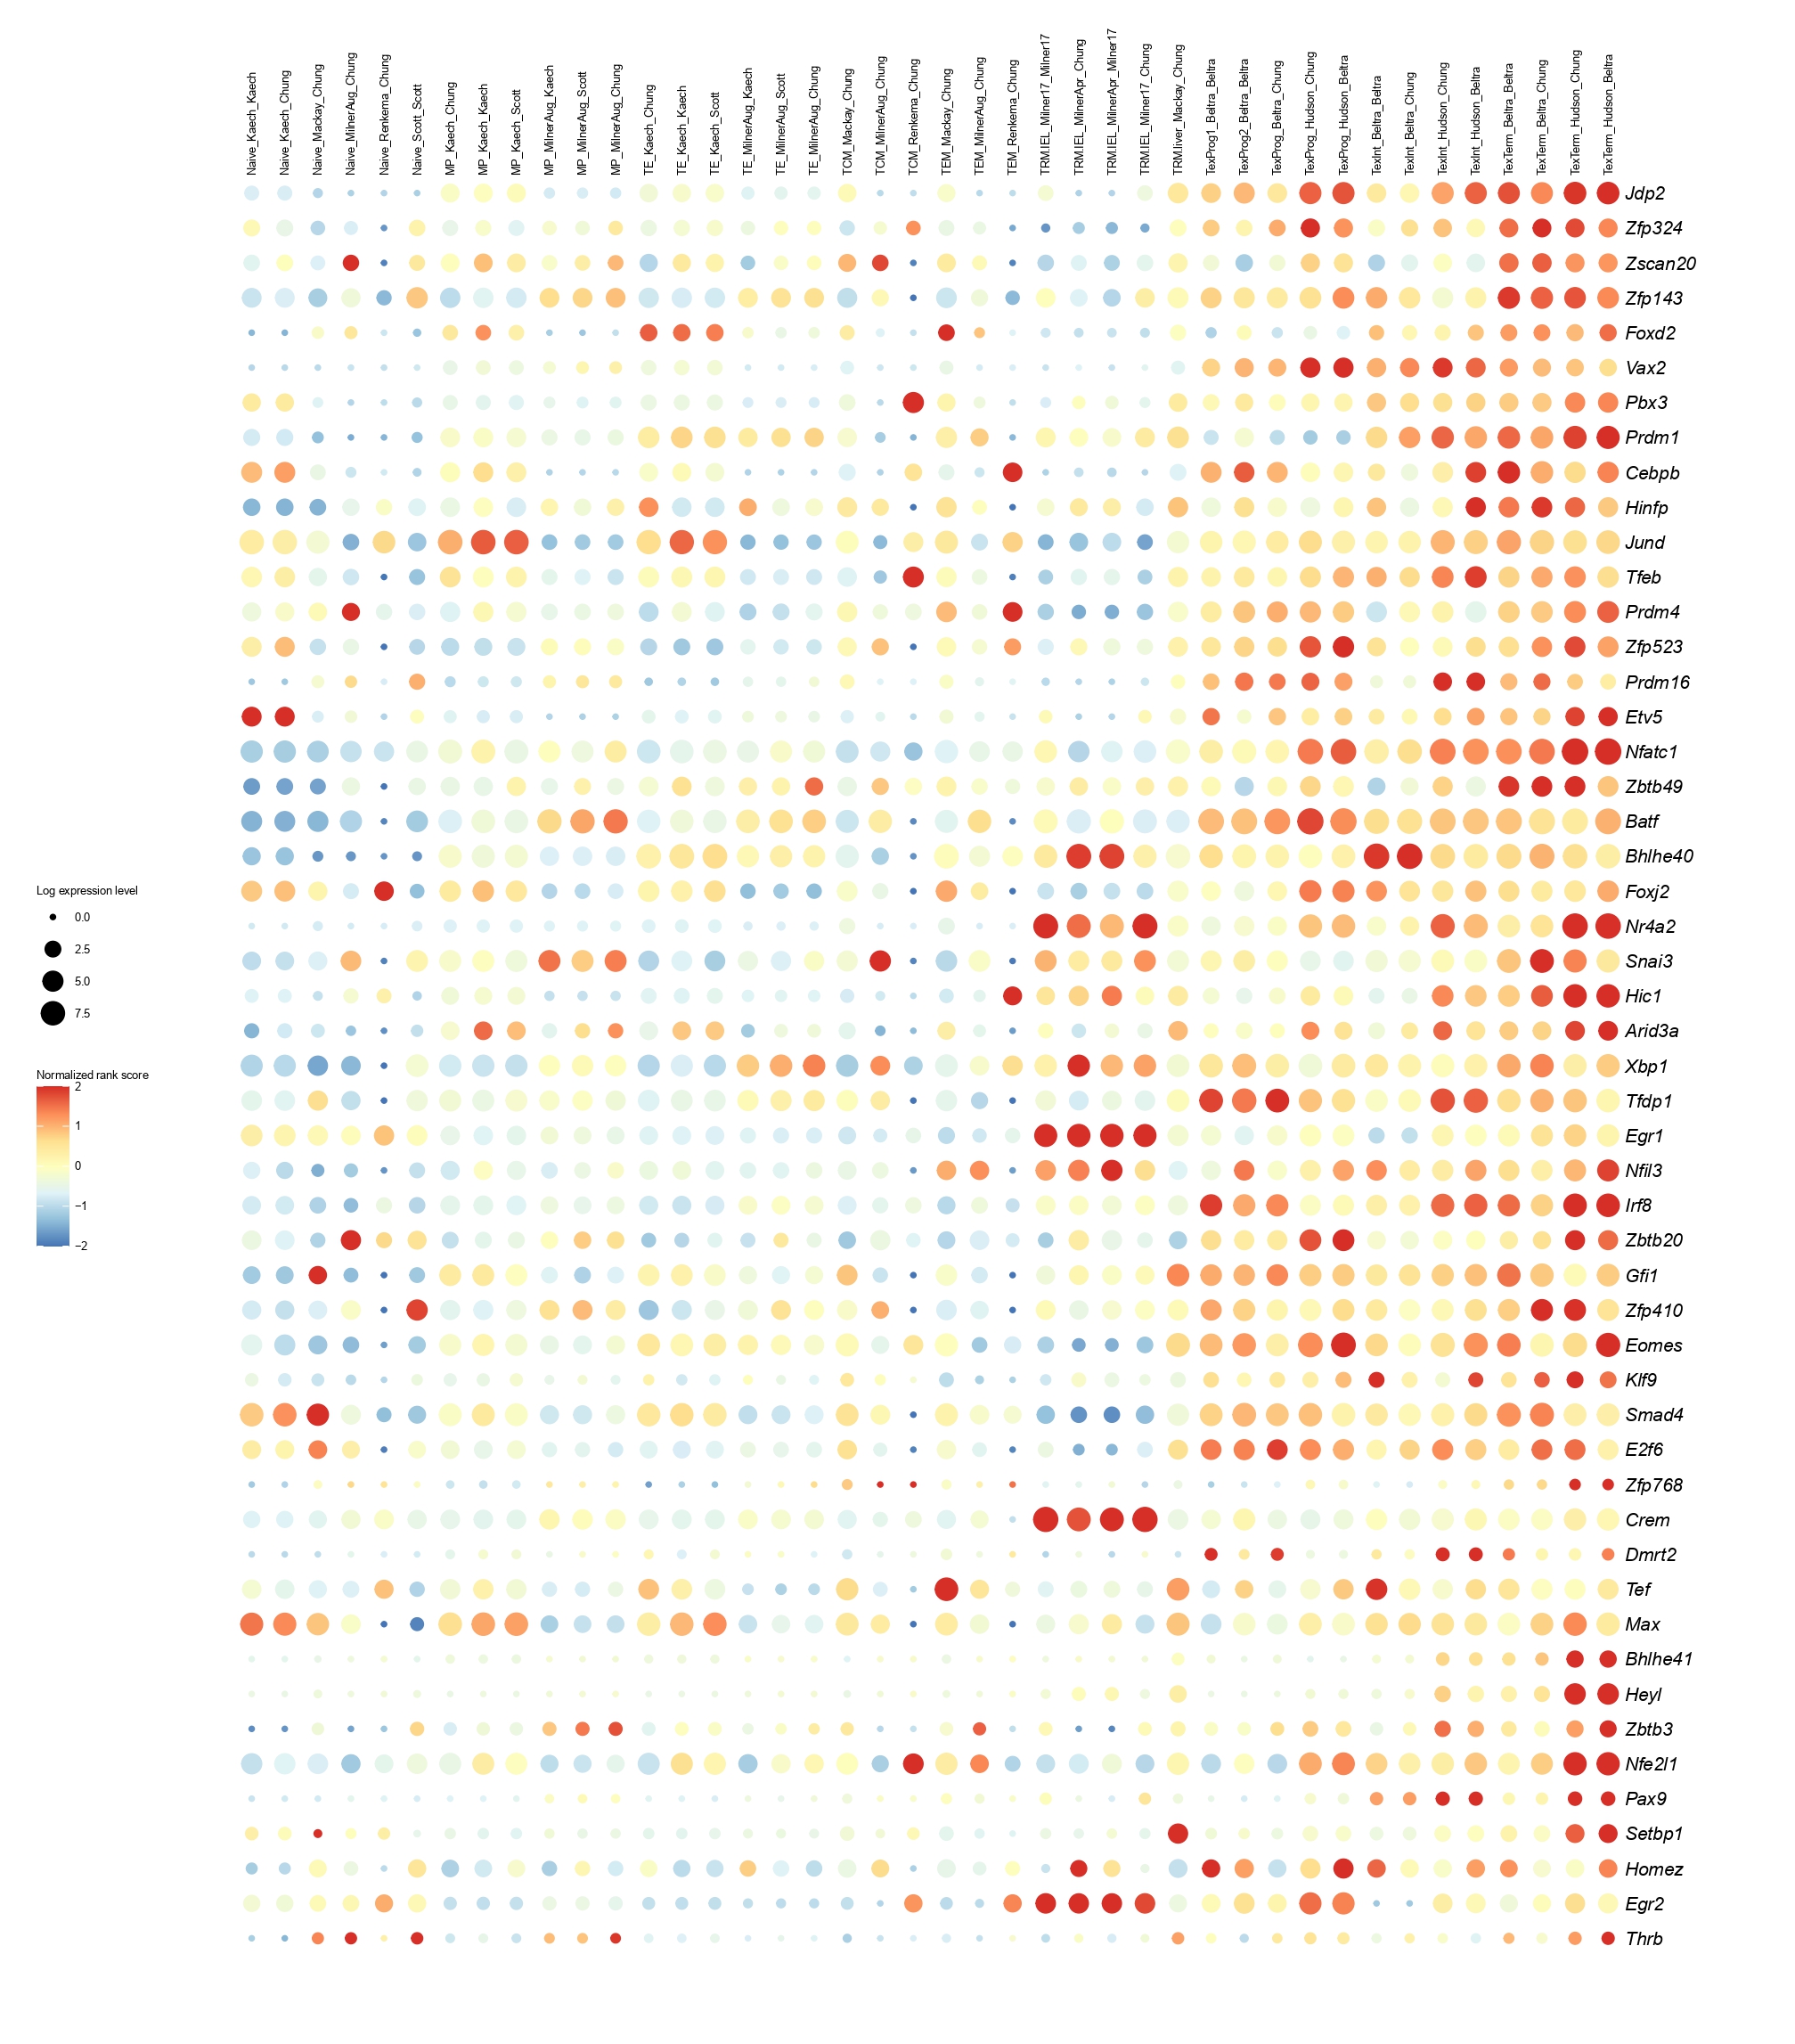
Below you will find the bubble plot and a searchable excel file containing all the normalized TF activity scores
Circle size represents the logarithm of gene expression, and the color represents the normalized PageRank score.
Below you will find the bubble plot and a searchable excel file containing all the normalized TF activity scores
Circle size represents the logarithm of gene expression, and the color represents the normalized PageRank score.
Below you will find the bubble plot and a searchable excel file containing all the normalized TF activity scores.
Circle size represents the logarithm of gene expression, and the color represents the normalized PageRank score.
Below you will find the bubble plot and a searchable excel file containing all the normalized TF activity scores
Below you will find the bubble plot and a searchable excel file containing all the normalized TF activity scores
Circle size represents the logarithm of gene expression, and the color represents the normalized PageRank score.
Below you will find the bubble plot and a searchable excel file containing all the normalized TF activity scores
Circle size represents the logarithm of gene expression, and the color represents the normalized PageRank score.
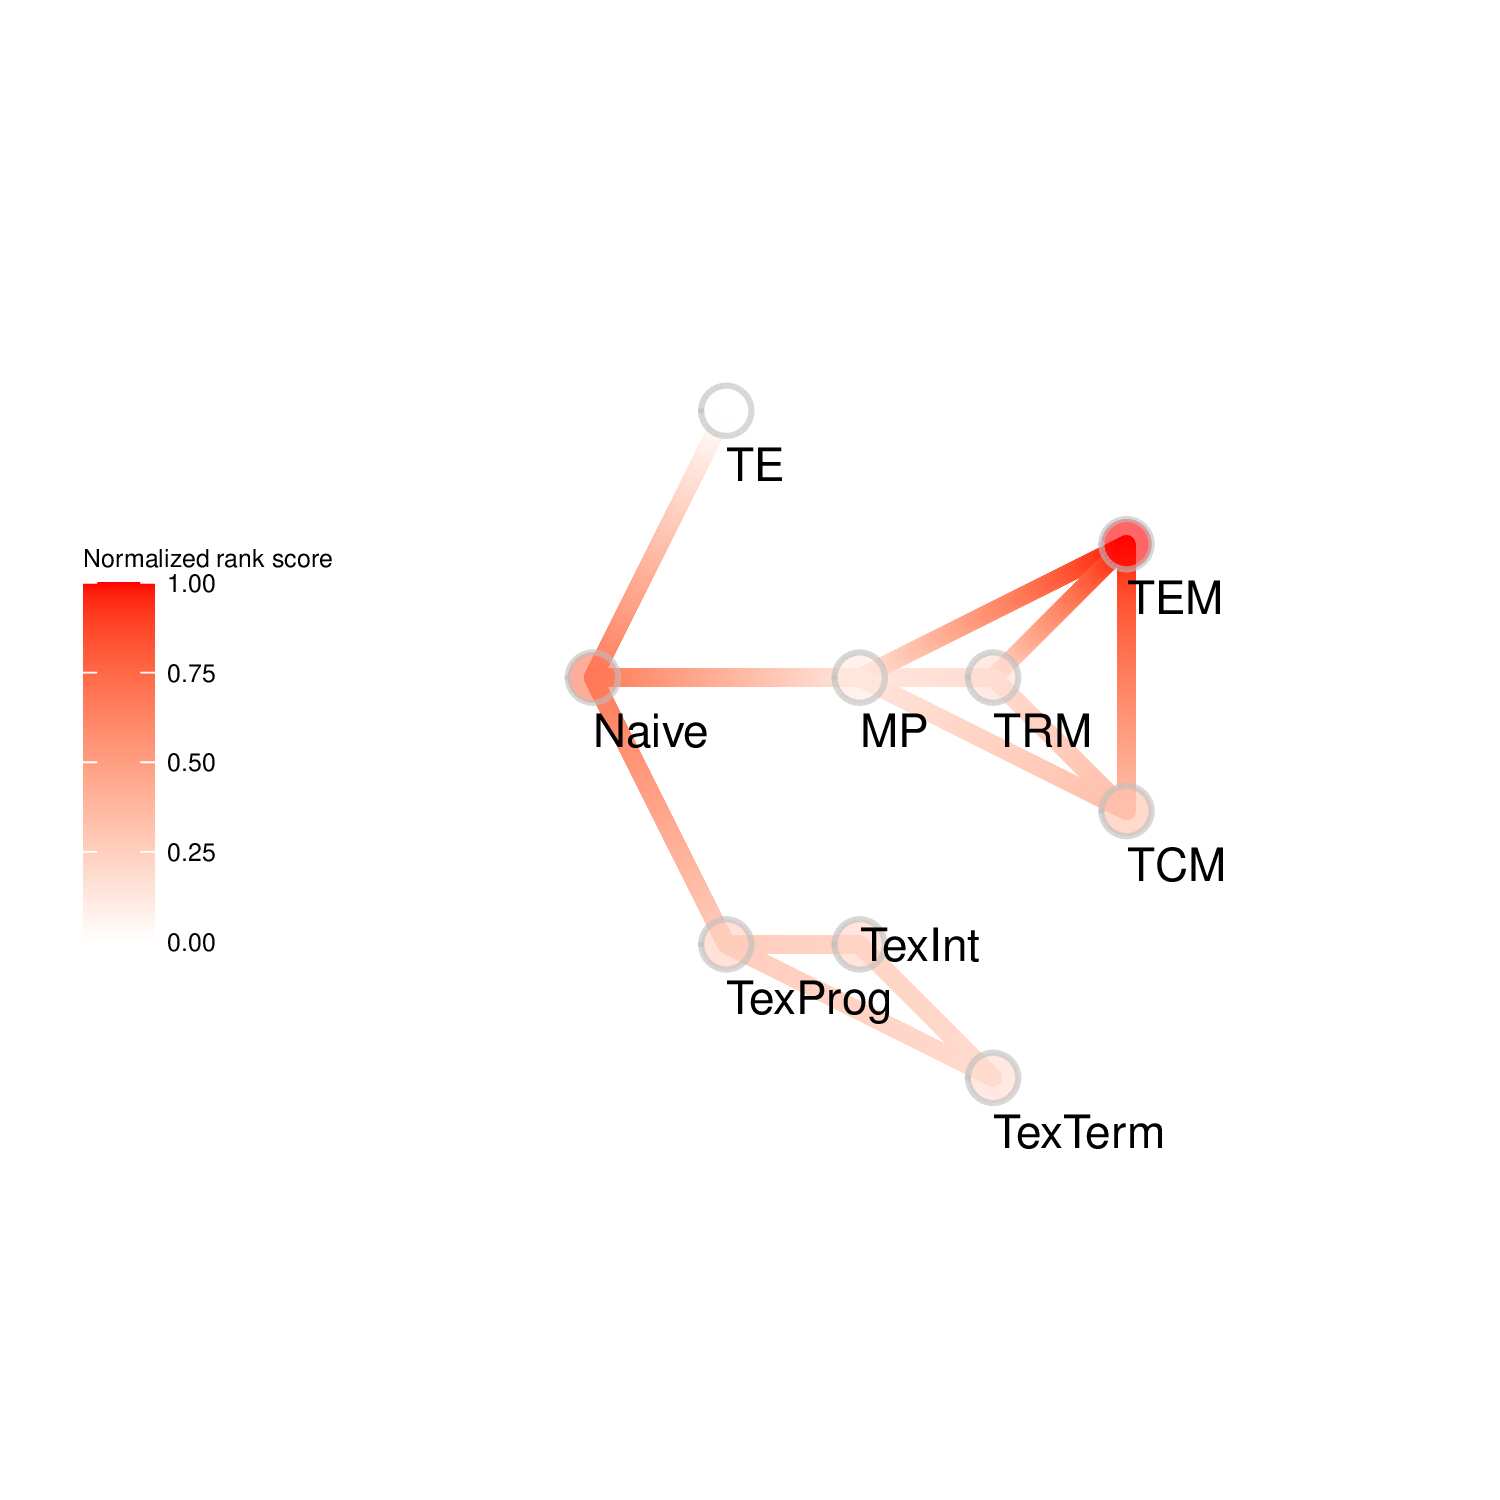
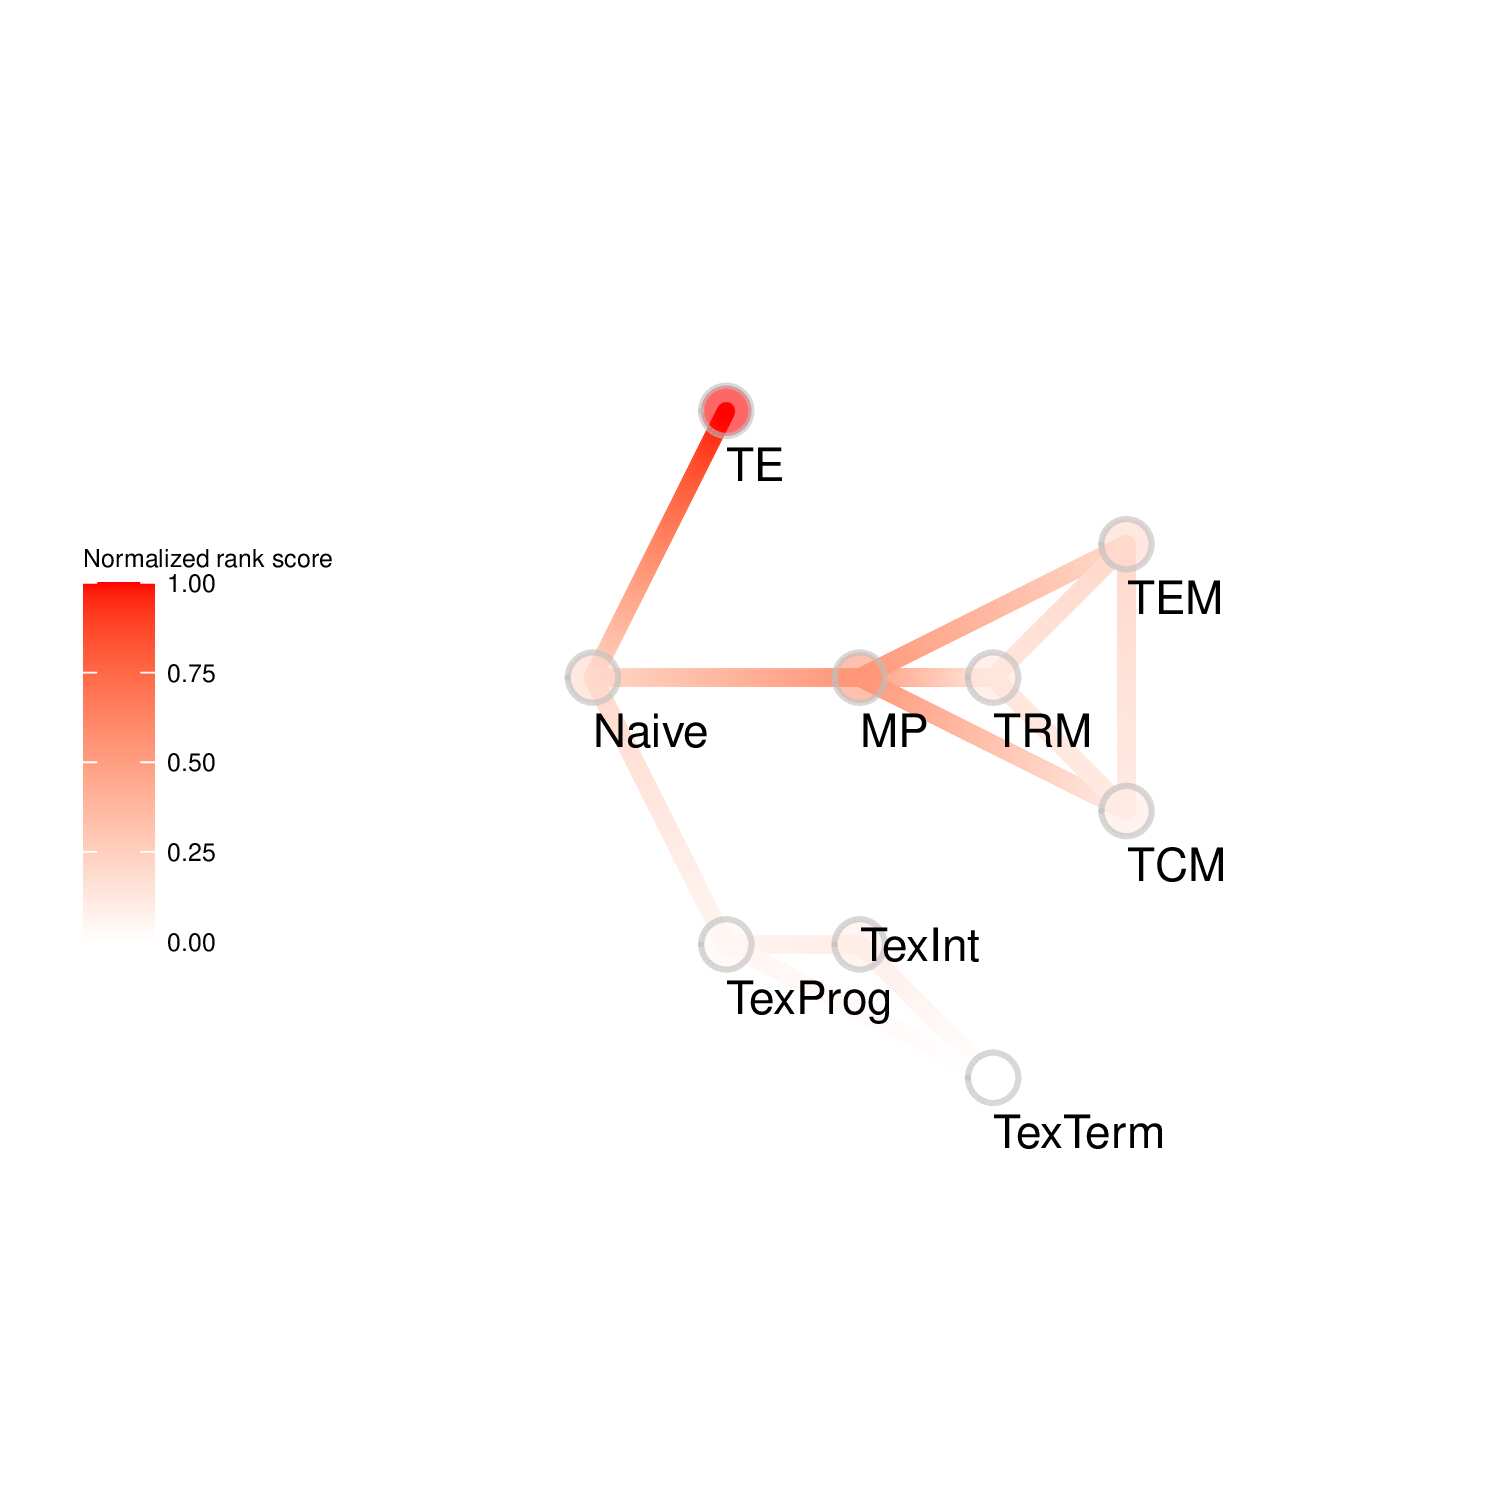
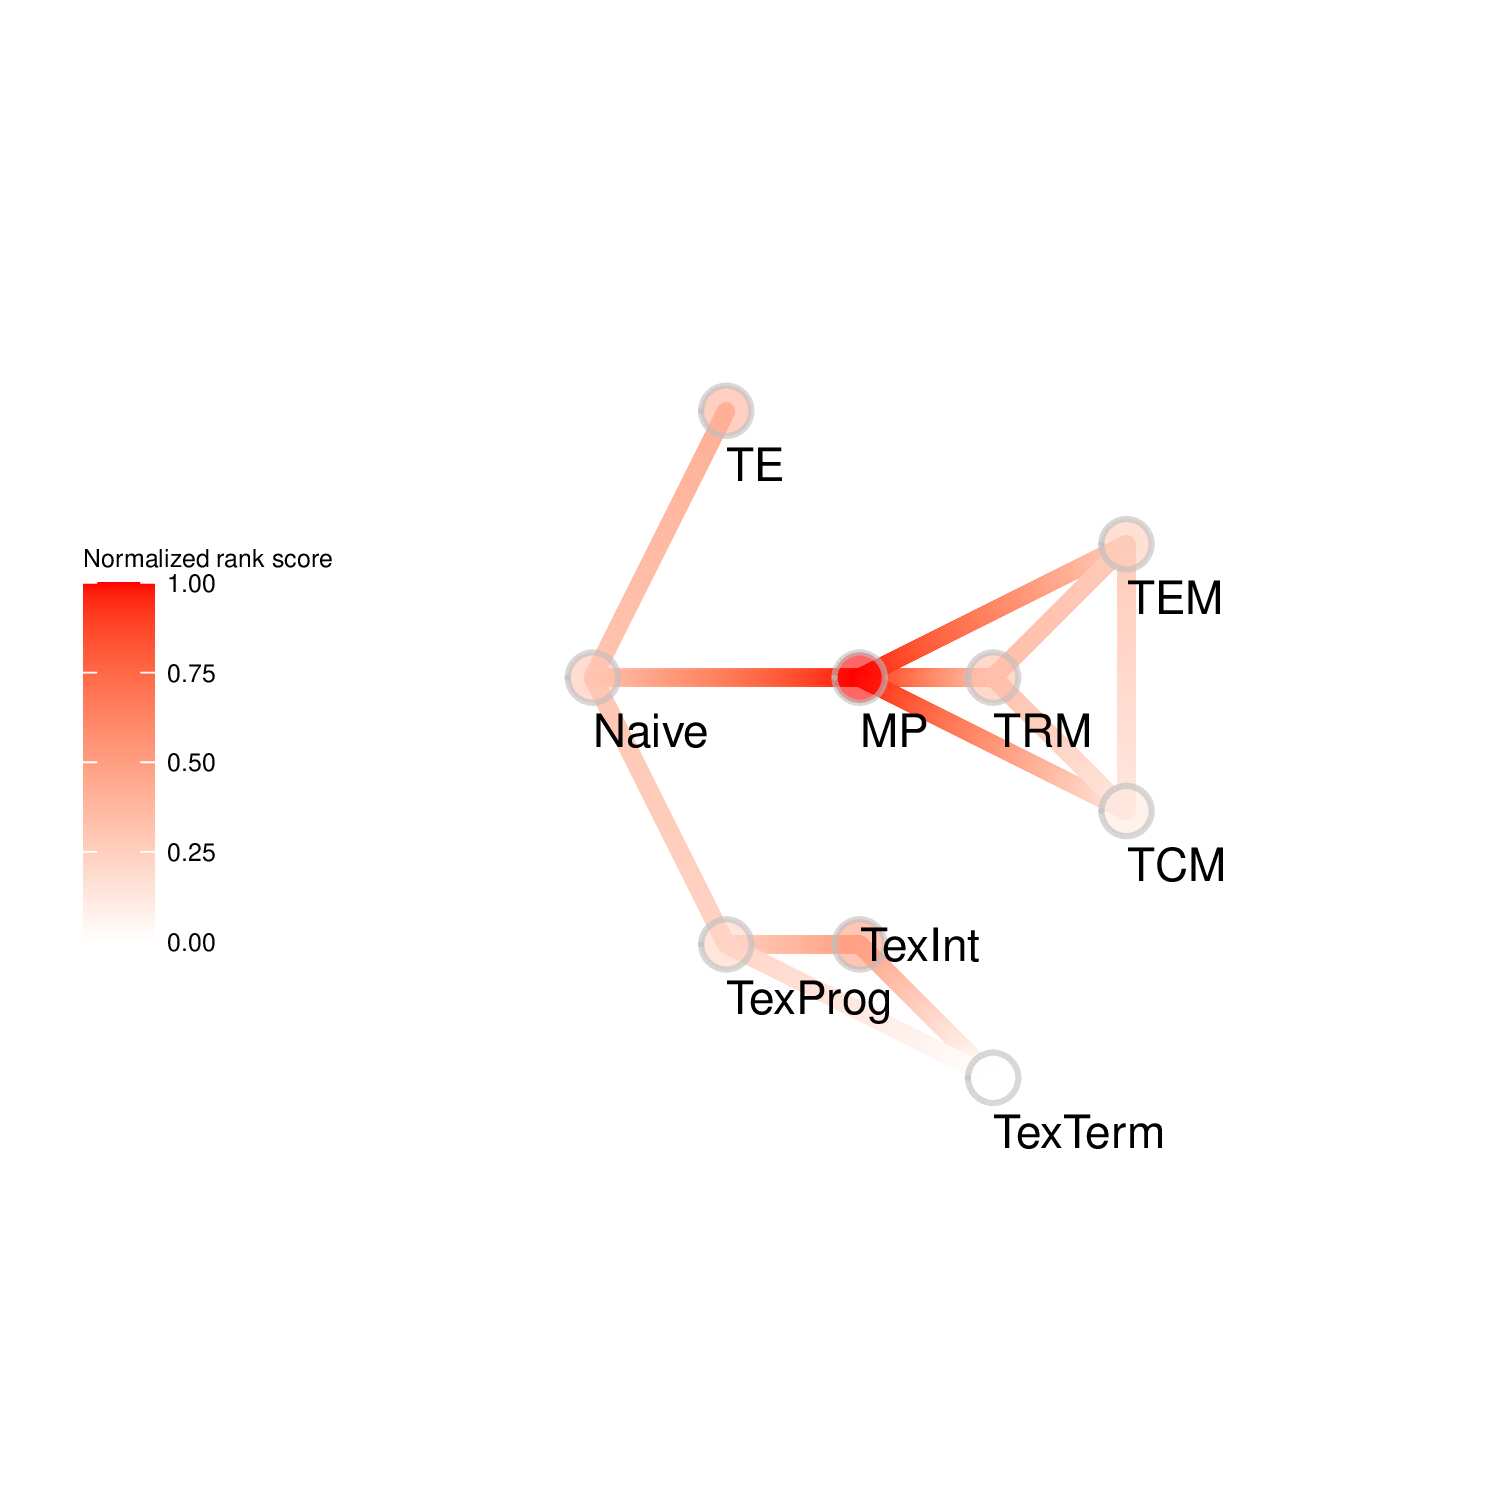
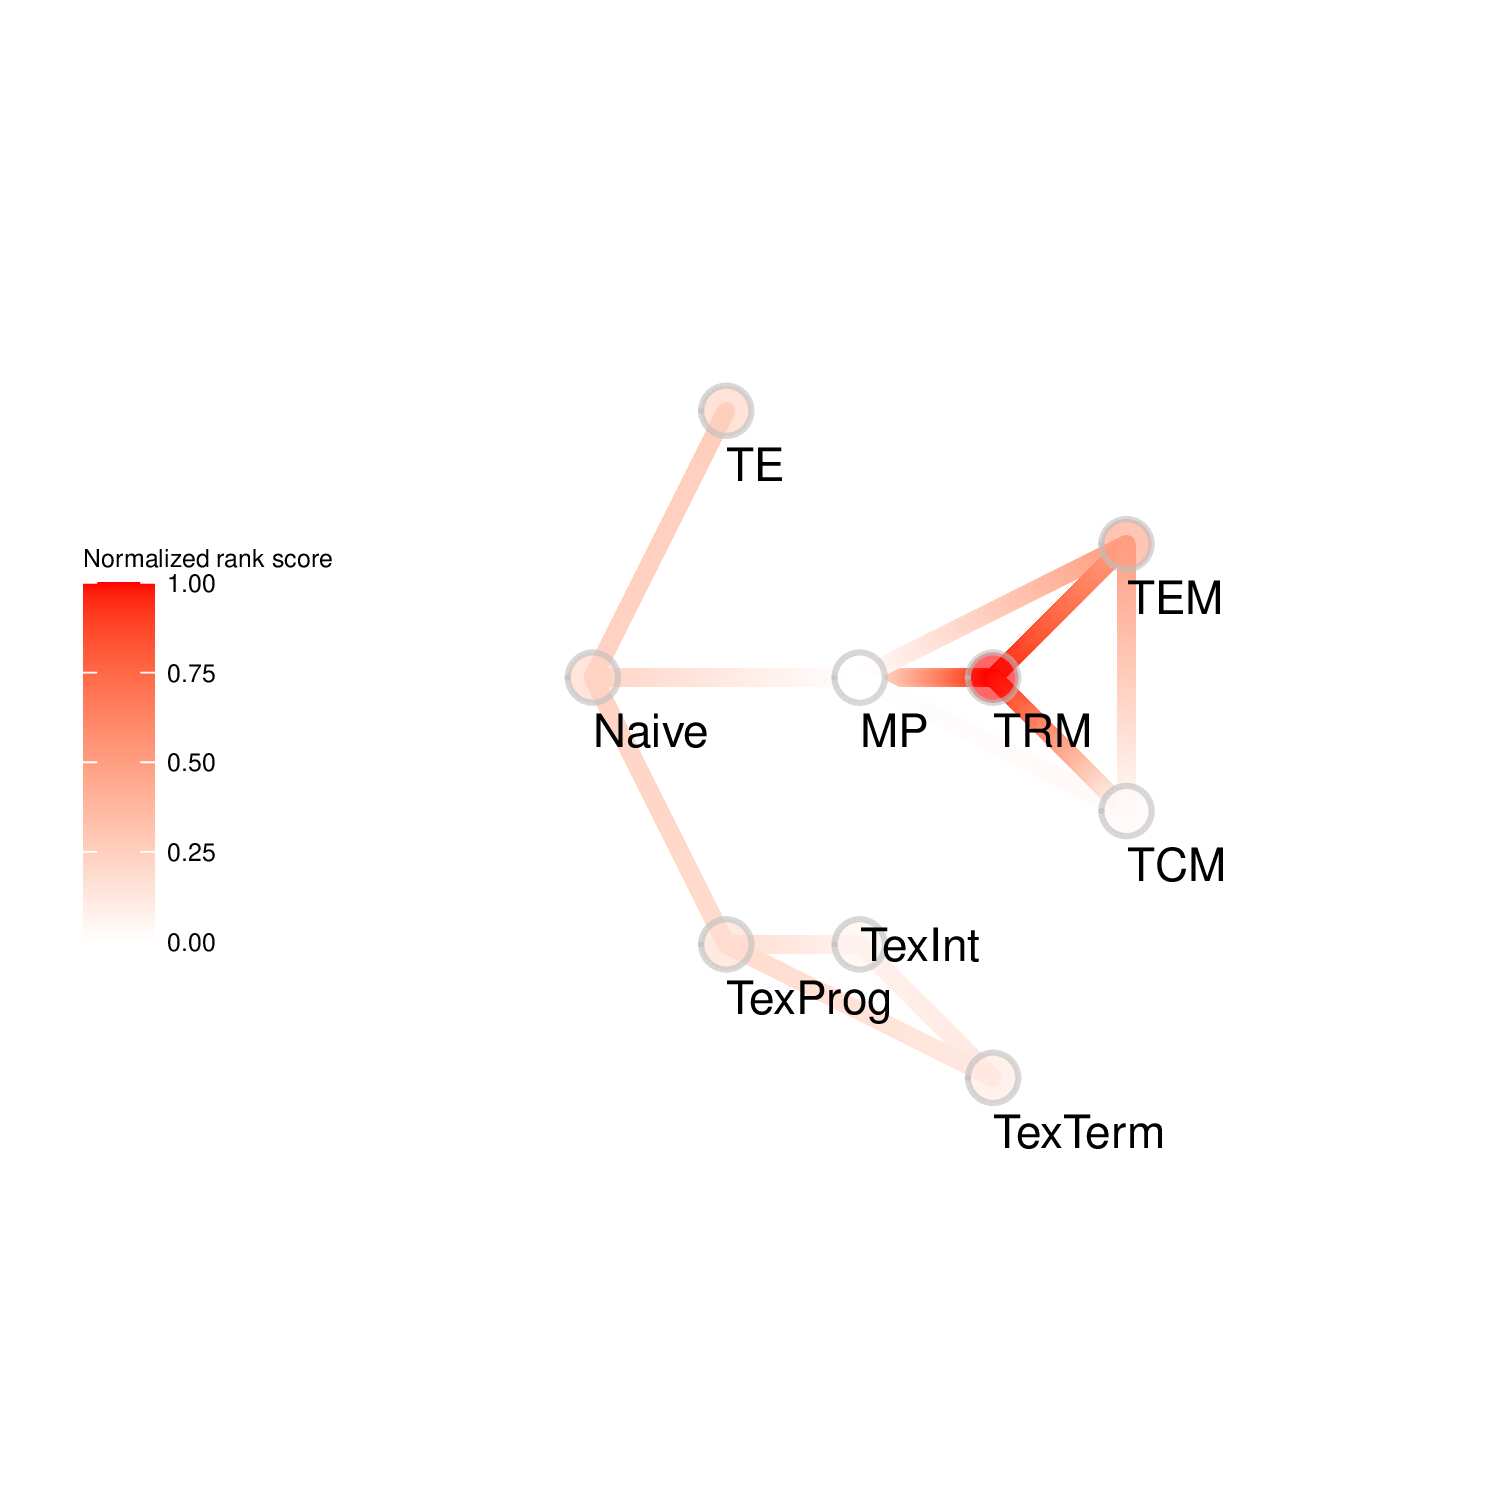
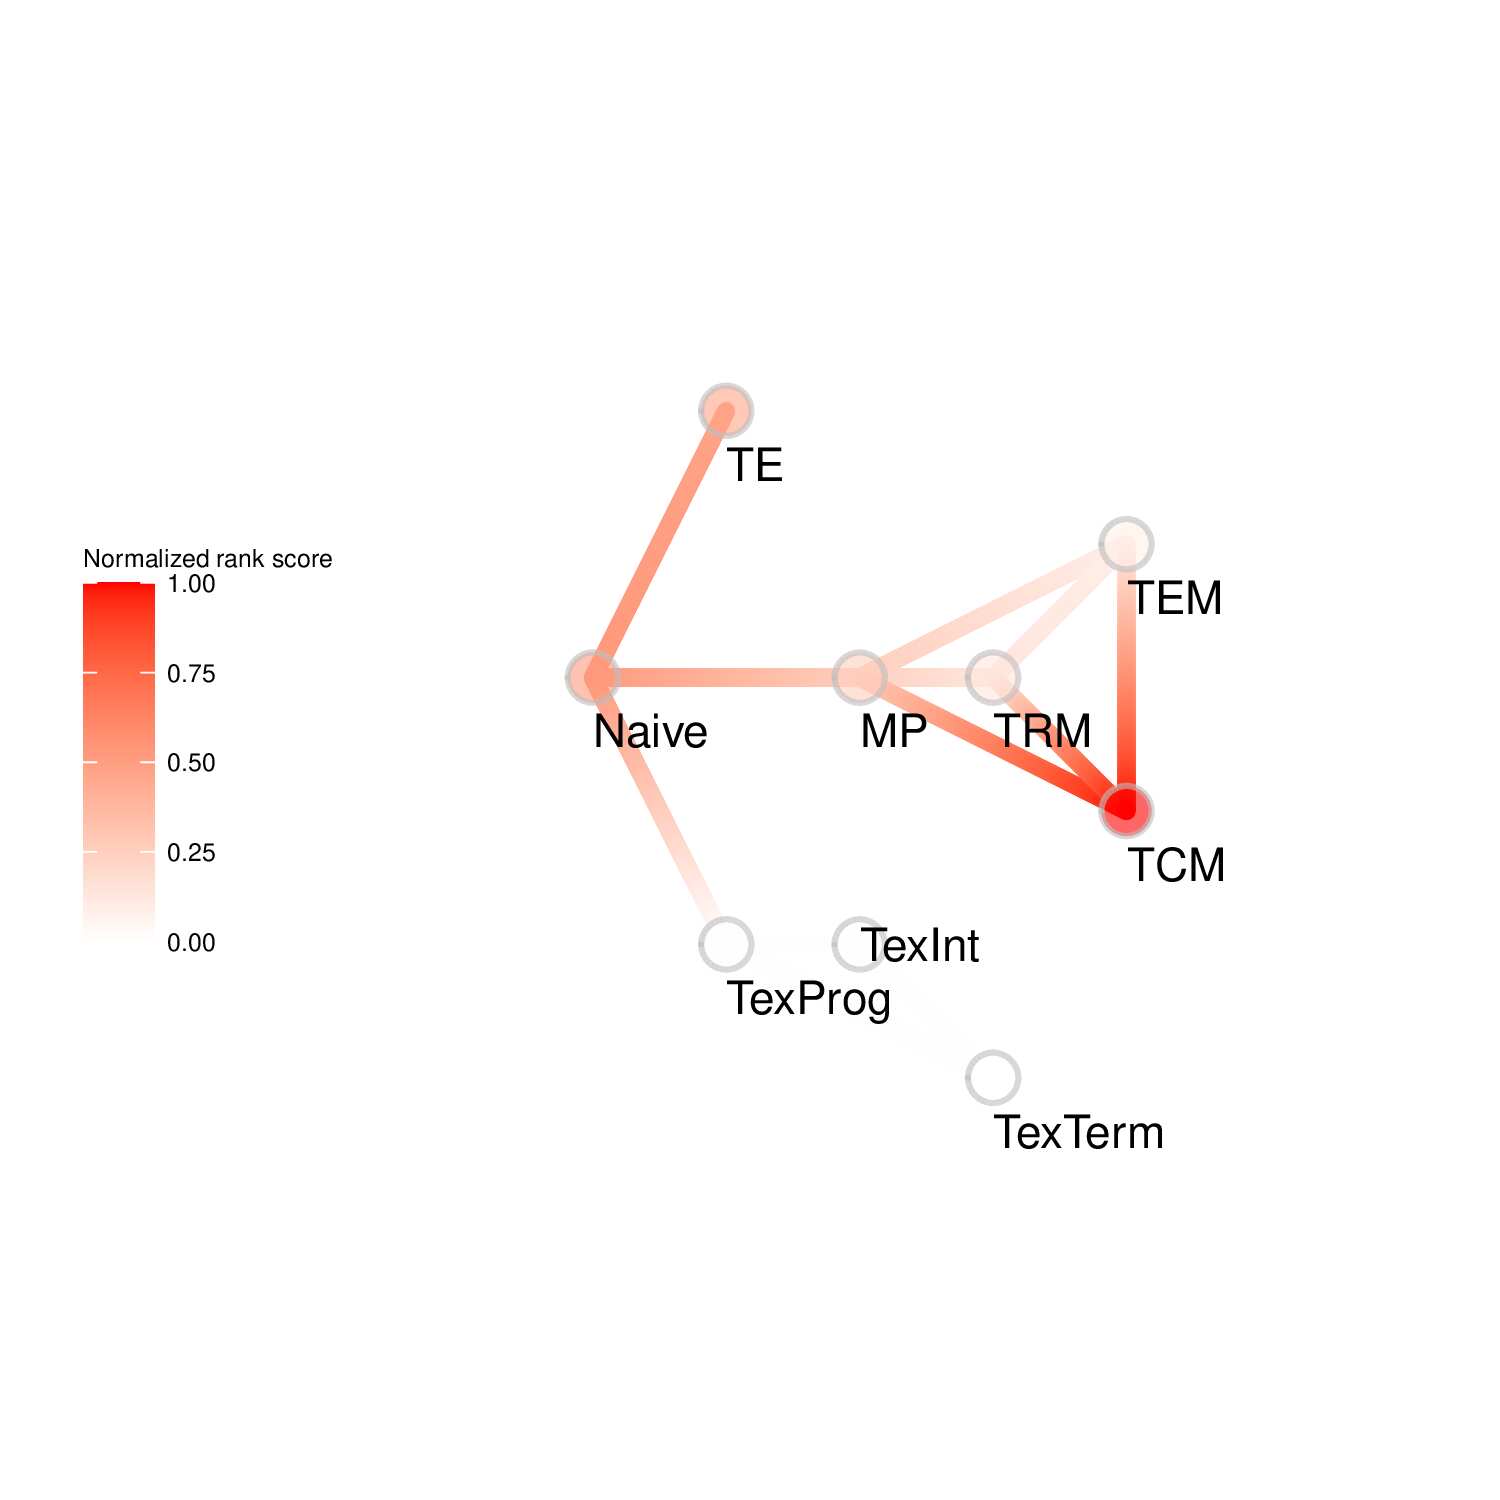
To evaluate the predicted TFs governing specific T cell differentiation pathways, we identified dynamic activity patterns of TF groups, termed 'Transcription factor waves'. Transcription factor waves are generated via integration of the unbiased clustering and prior immunology knowledge. This curates catalogs of TFs associated with different cell states or differentiation trajectories. Circles represent specific cell state. Color indicates normalized PageRank scores with red displaying high values. Click to check TFs and GSEA results associated with each wave.
TF Waves
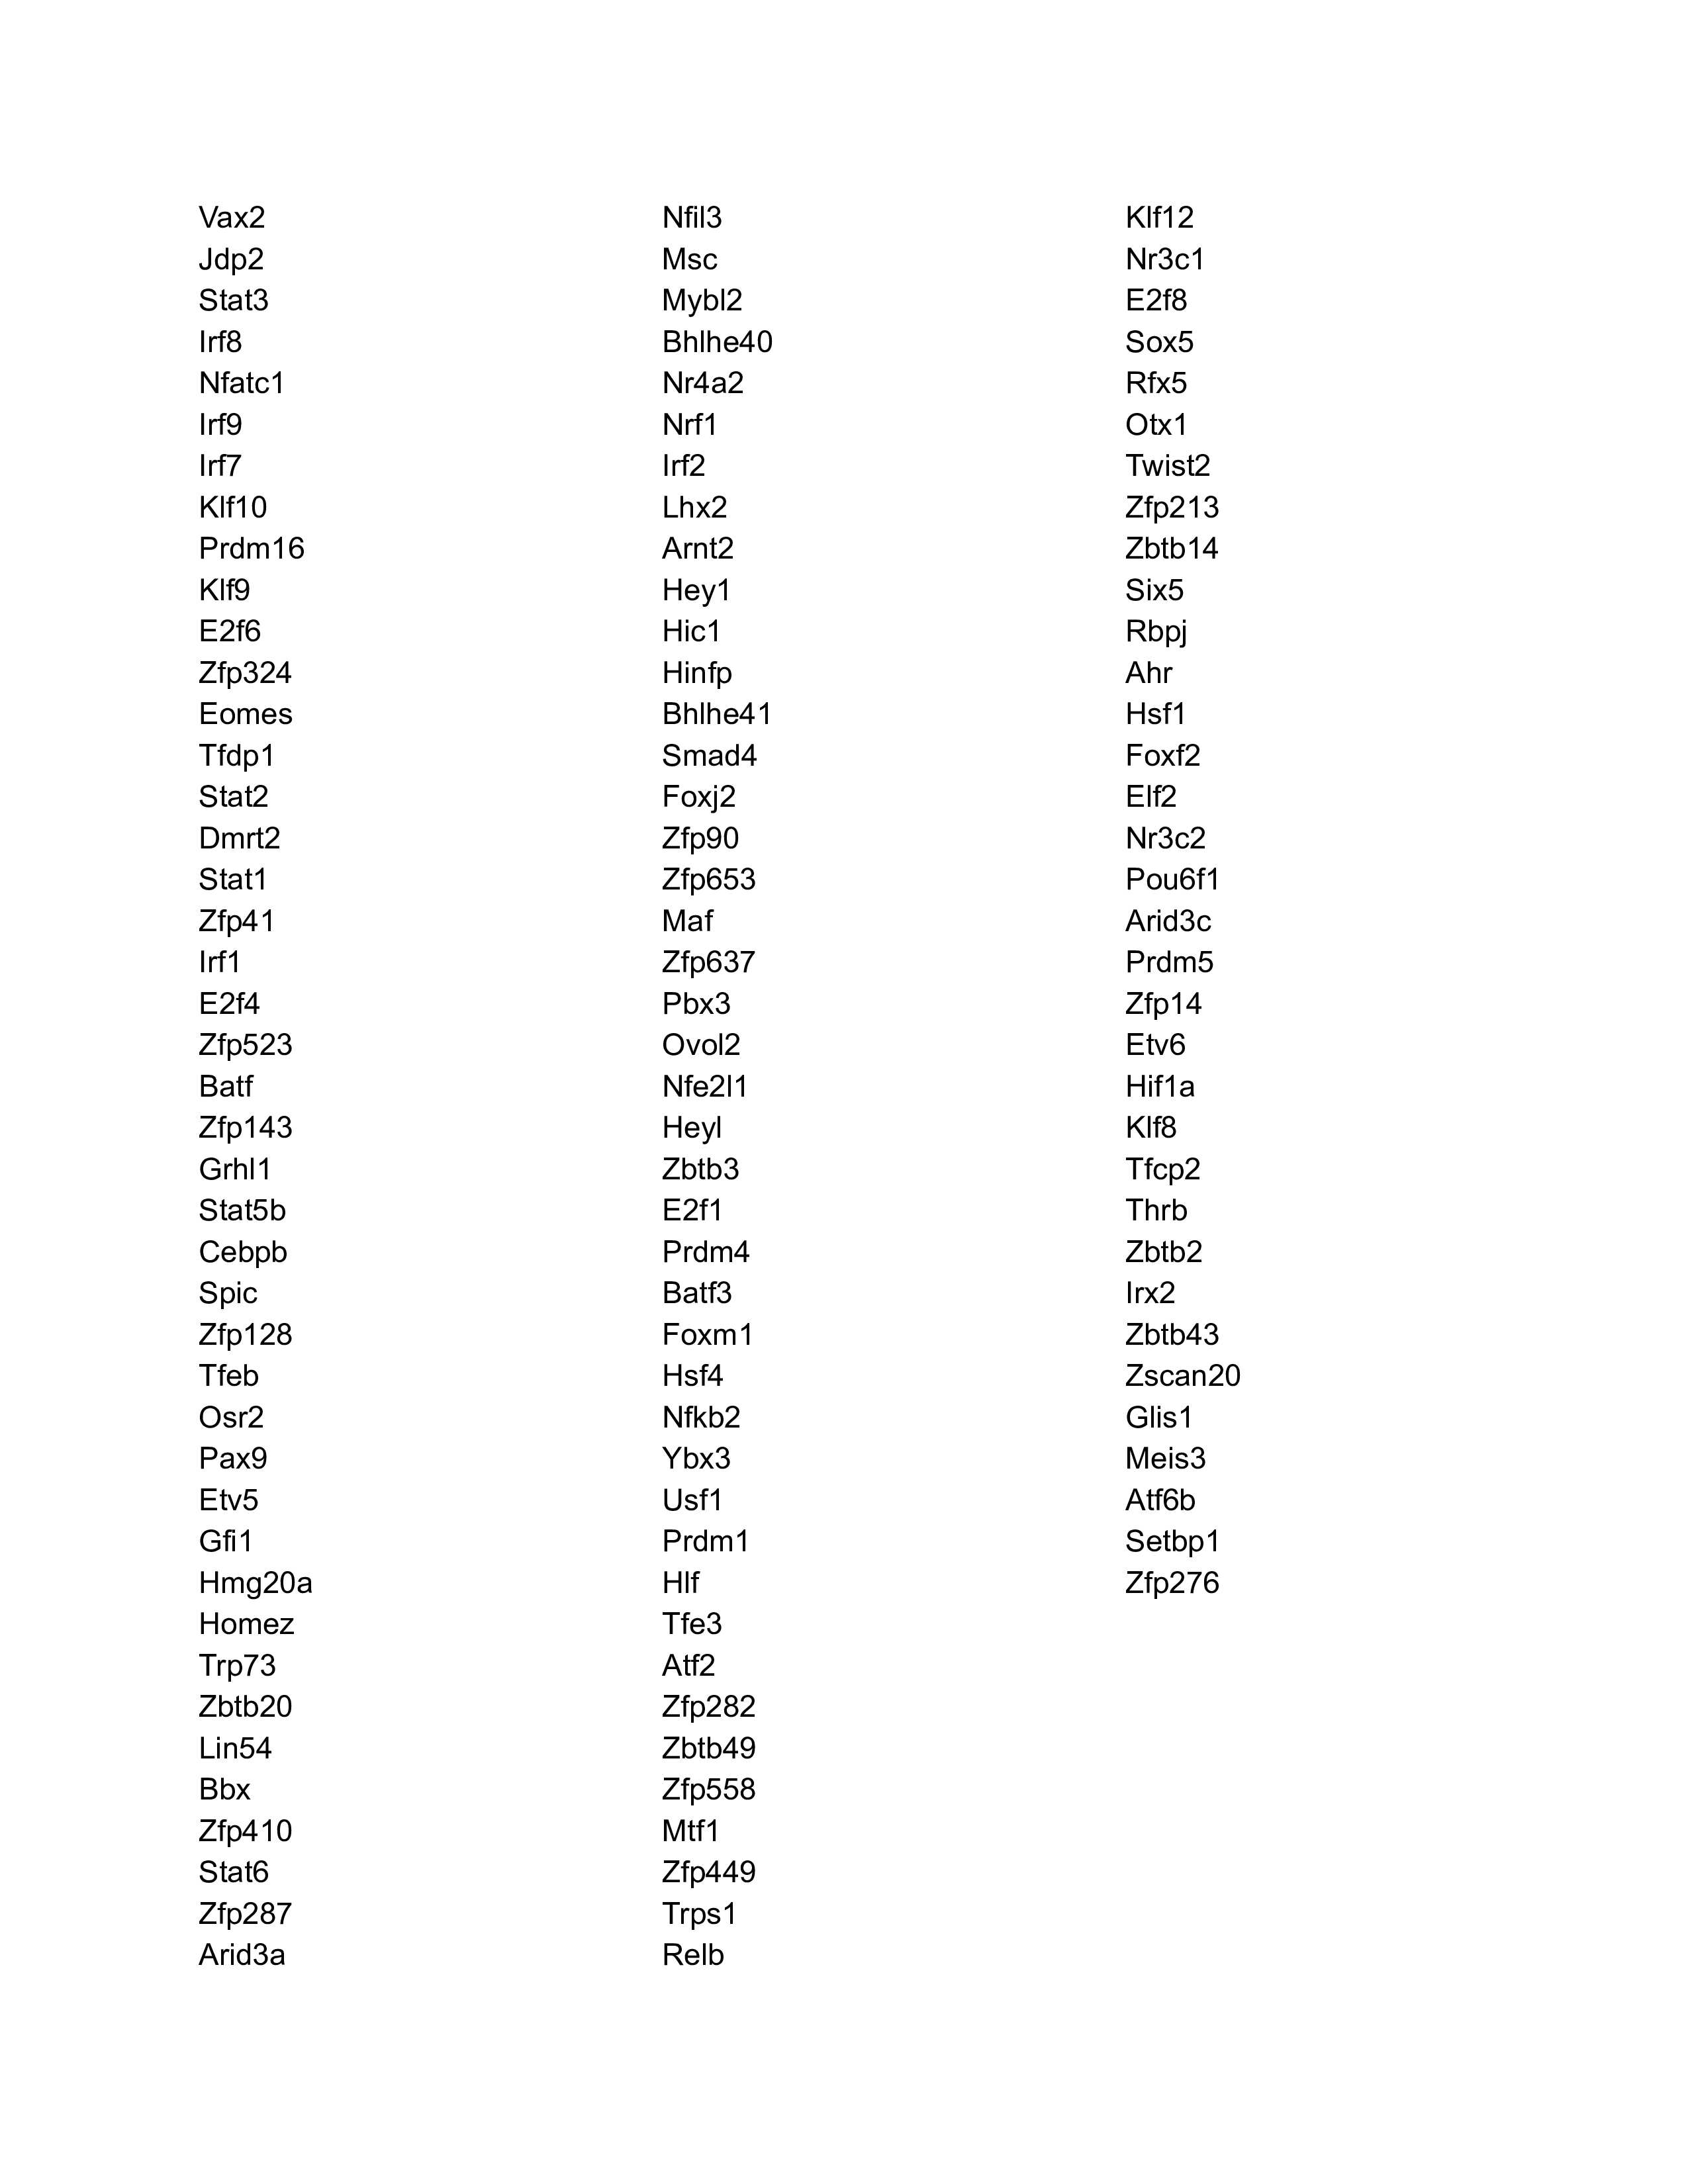
Seven TF waves associated with distinctive biological pathways were identified. For example, the TRM TF wave (Wave 6) includes several members of the AP-1 family (e.g. Atf3, Fosb, Fosl2, and Jun), which aligns well with a recent report of their roles in TRM formation ( link ). This wave was uniquely linked to the transforming growth factor beta (TGFβ) response pathway. Conversely, the TEX TF (including TEXprog, TEXeff, and TEXterm) wave, Wave 2, was characterized by a distinct set of TFs, such as Irf8, Jdp2, Nfatc1, and Vax2, among others, that correlated with pathways related to PD1 and senescence.
Click on the wave images below to be redirected to their corresponding pages and learn more about them!
Details about the Wave 1 analysis go here.
Wave 1
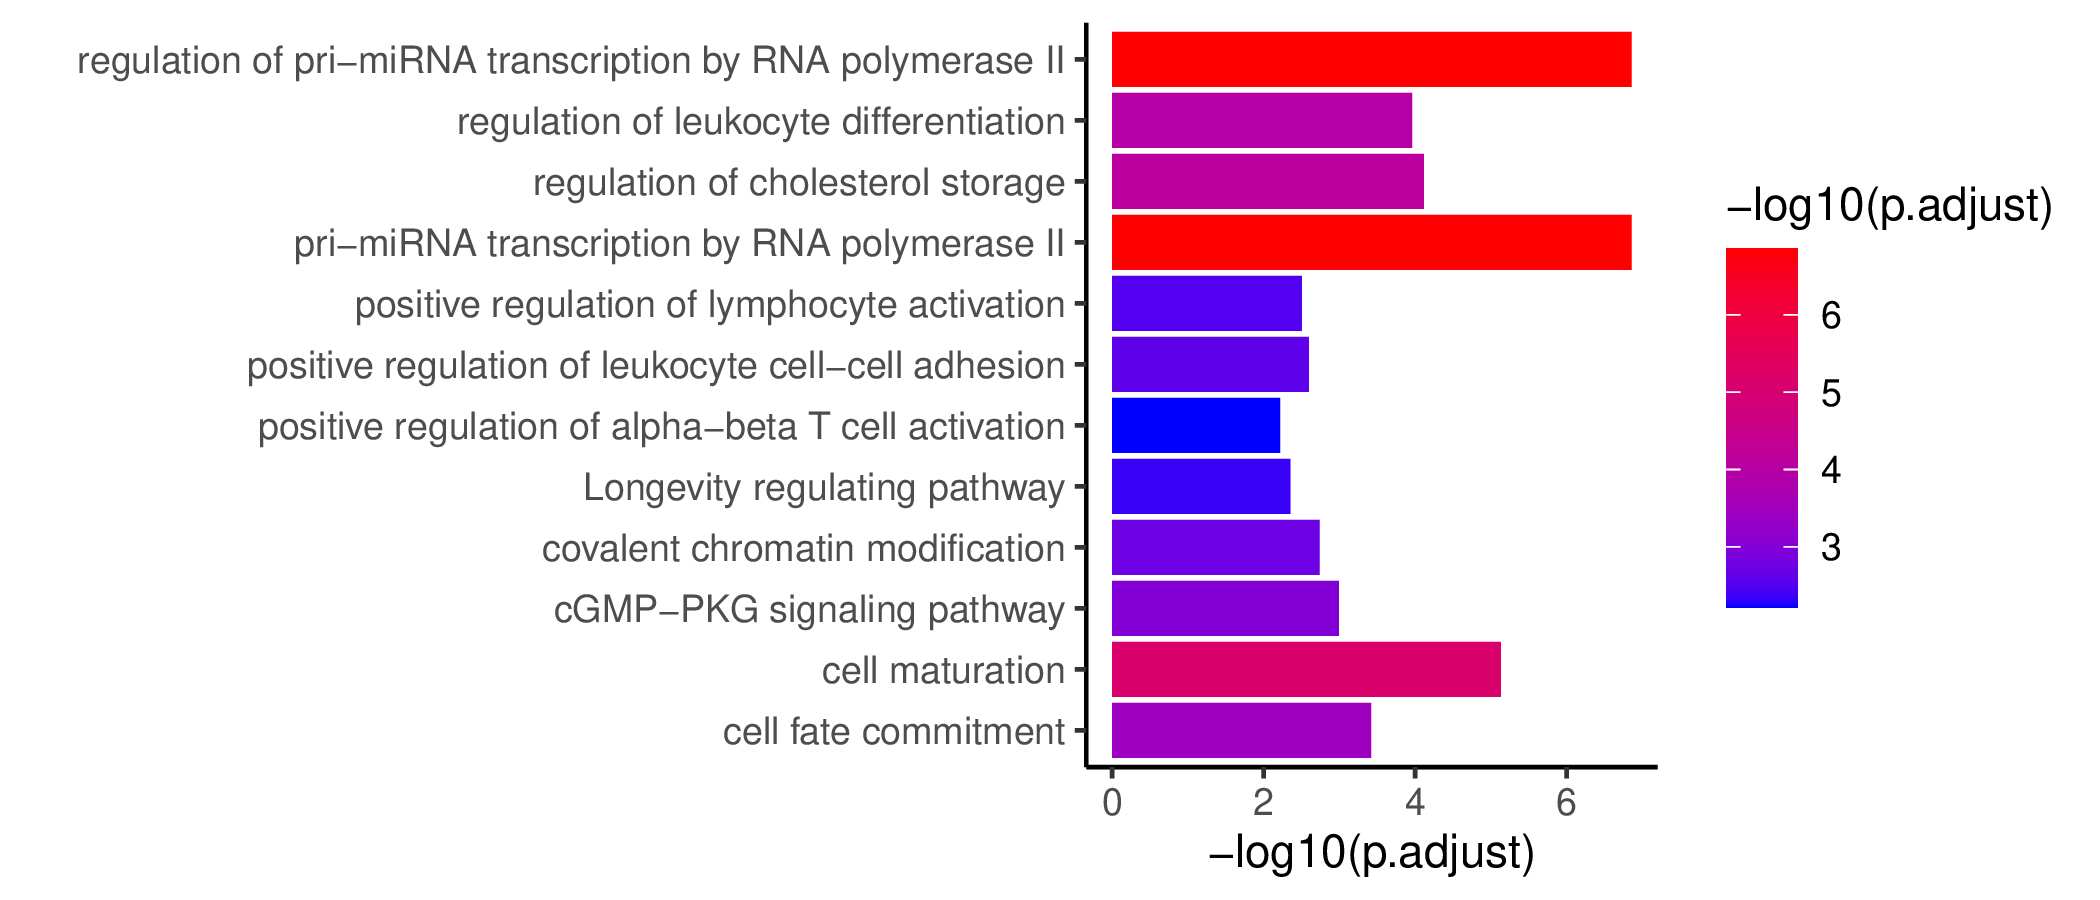
GO KEGG Result
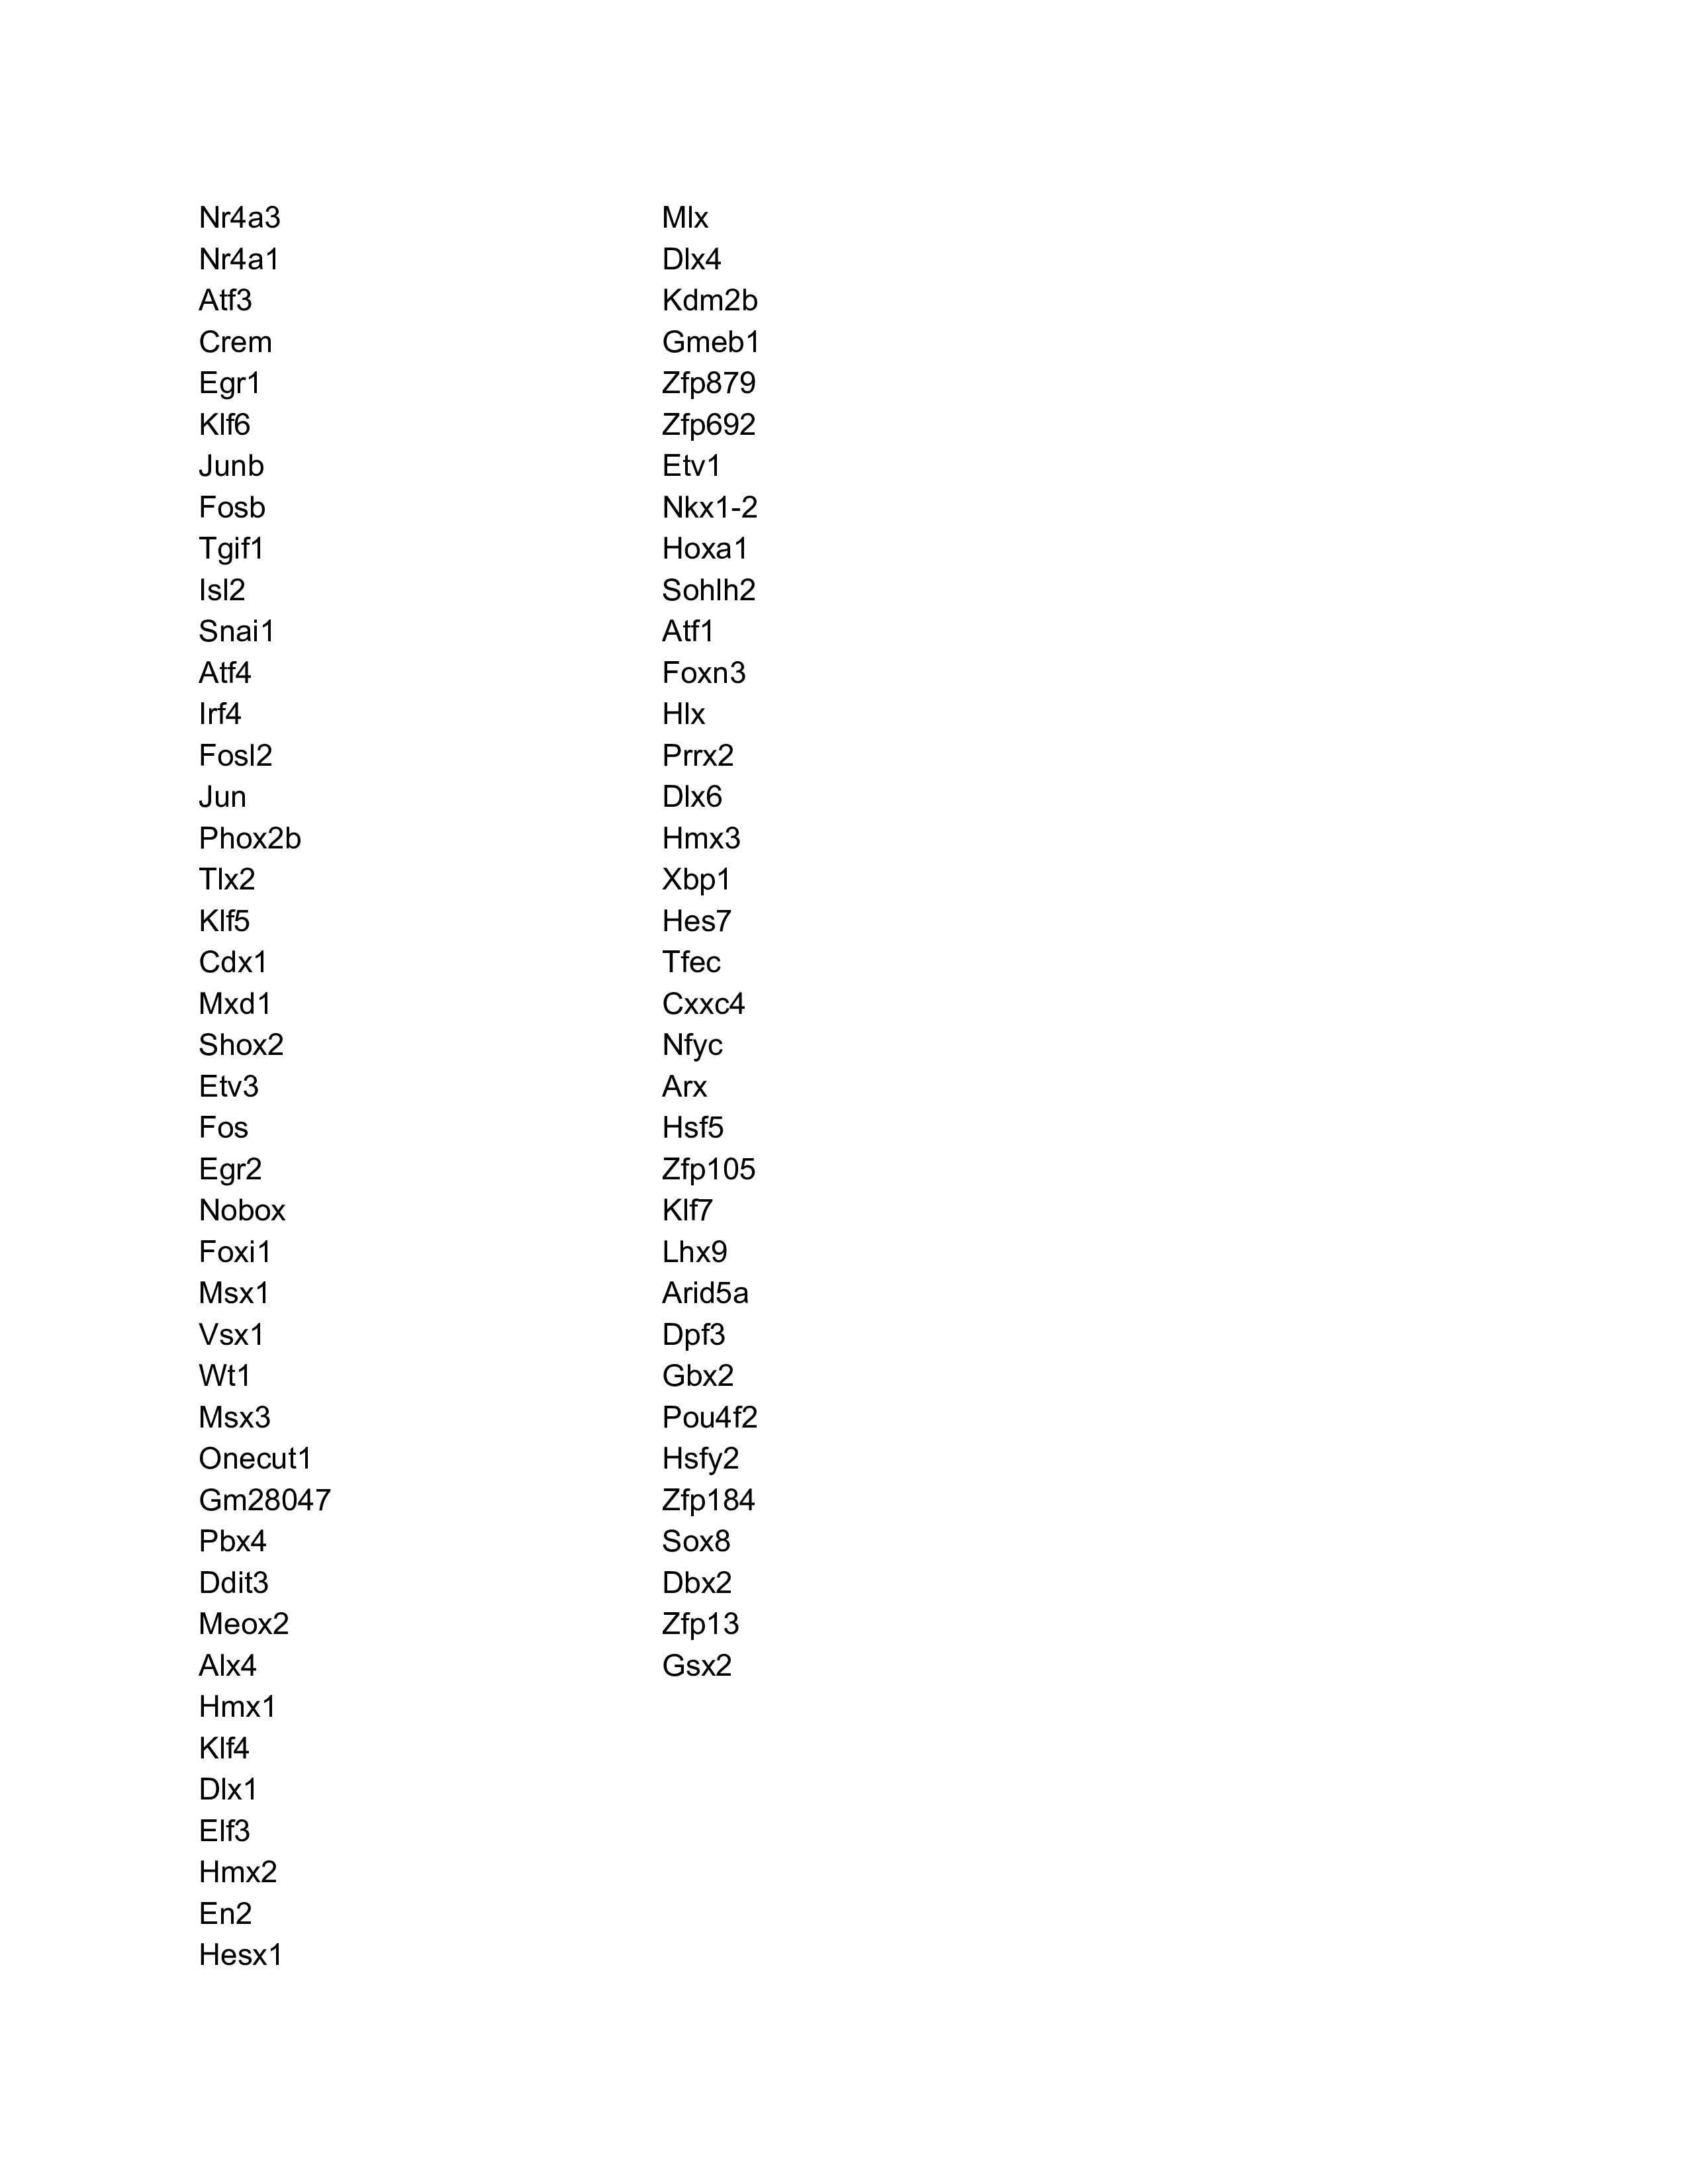
Ranked Text
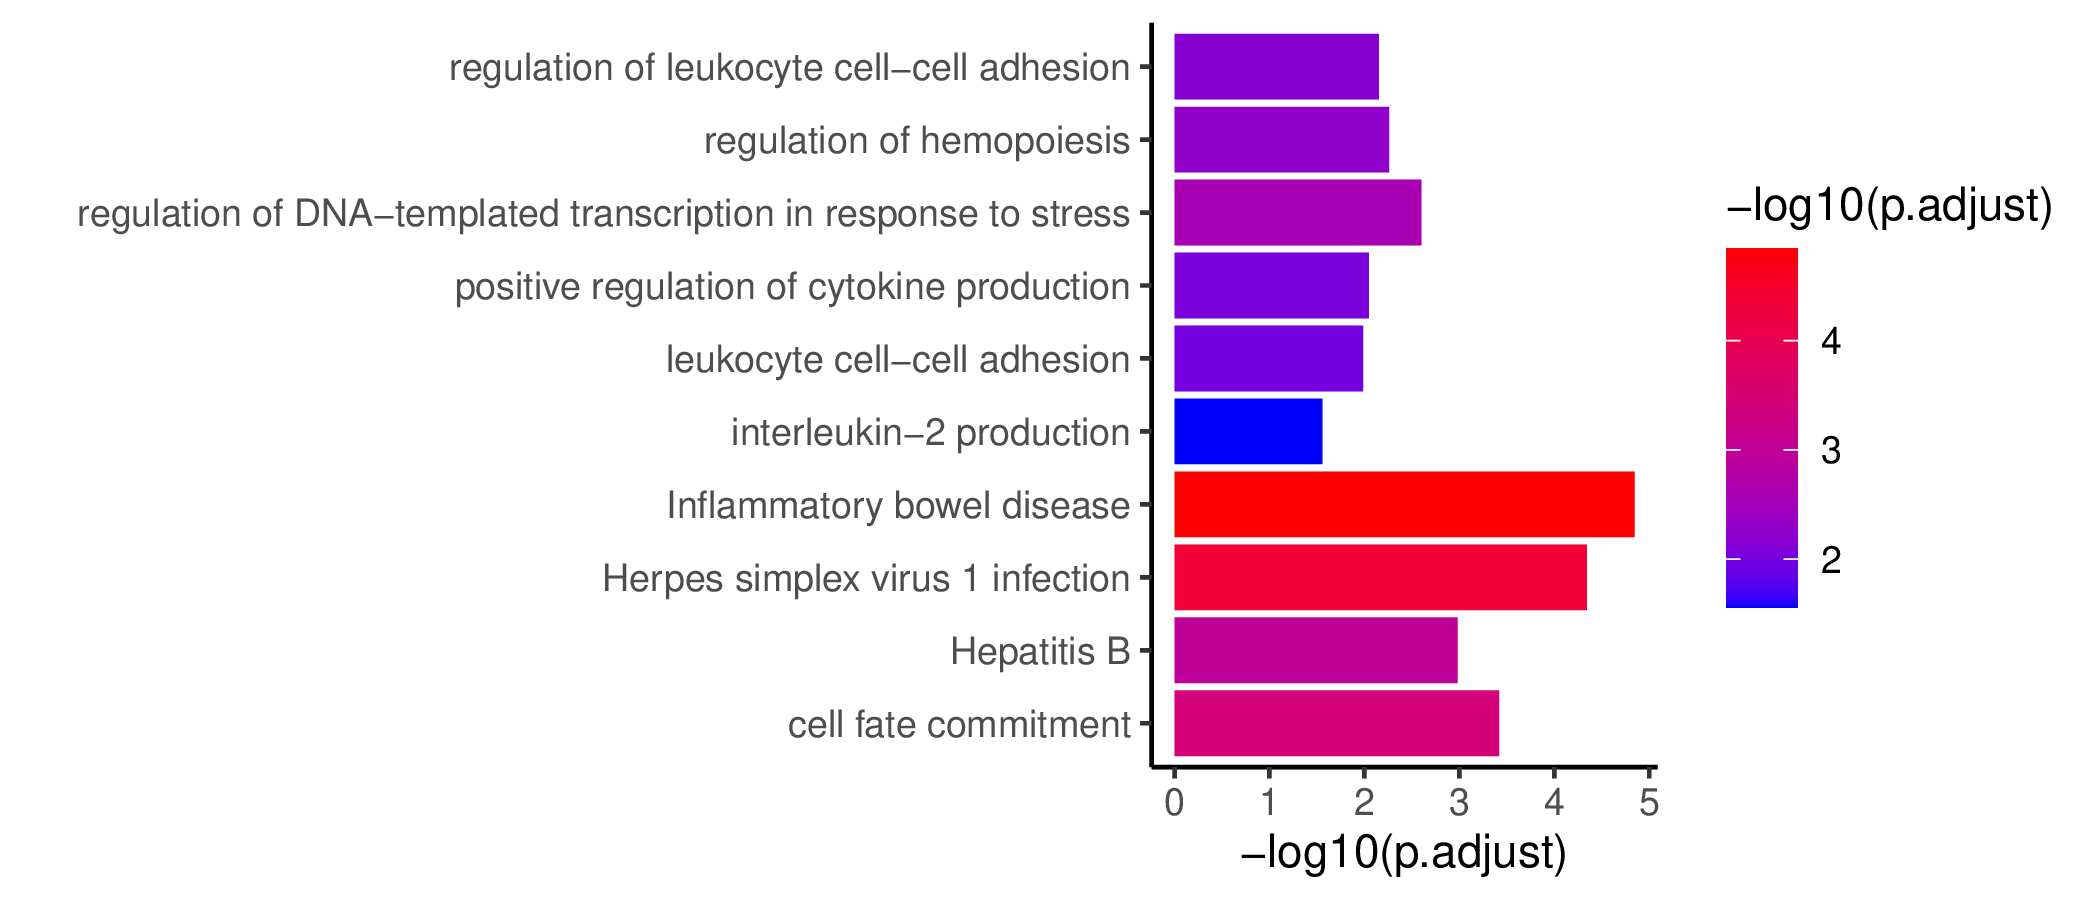
Details about the Wave 2 analysis go here.
Wave 2
GO KEGG Result
Ranked Text
Details about the Wave 3 analysis go here.
Wave 3
GO KEGG Result
Ranked Text
Details about the Wave 4 analysis go here.
Wave 4
GO KEGG Result
Ranked Text
Details about the Wave 5 analysis go here.
Wave 5
GO KEGG Result
Ranked Text
Details about the Wave 6 analysis go here.
Wave 6
GO KEGG Result
Ranked Text
Details about the Wave 7 analysis go here.
Wave 7
GO KEGG Result
Ranked Text
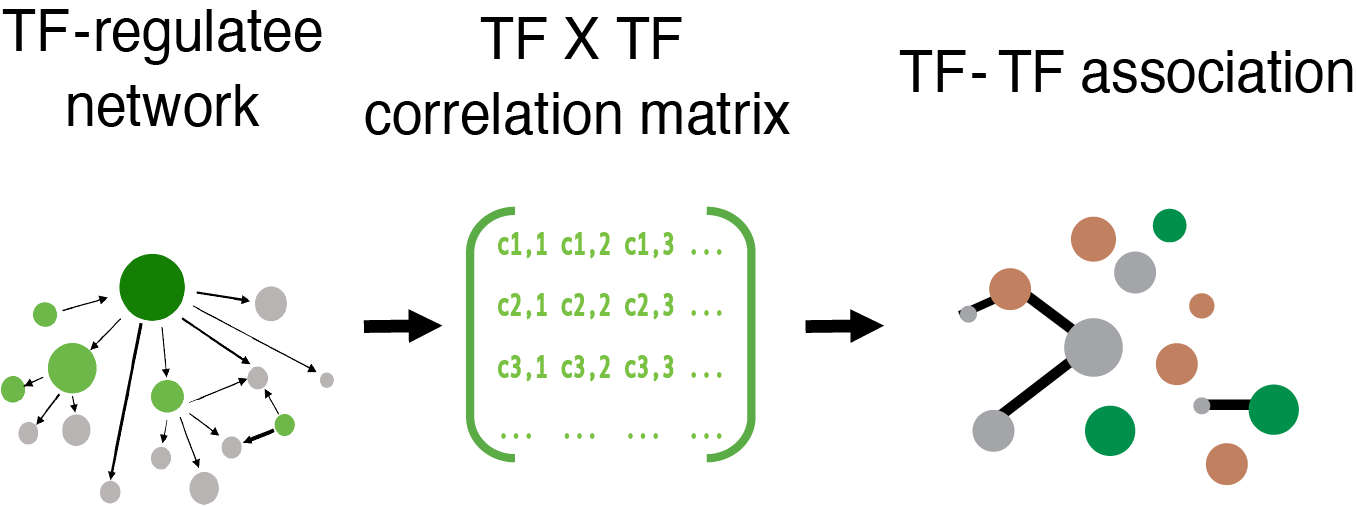
Inspired by DBPNet 1 which is a framework to identify cooperations between DNA-binding proteins using Chromatin immunoprecipitation followed by sequencing (ChIP-seq) and Hi-C data, we constructed TF interaction network based on Taiji's output, which is a TF-regulatee network. For each context, we first combined the cell state-important TFs and cell state-specific TFs. In total, 159 TFs for TEXterm and 170 TFs for TRM were selected. We then combined TEXterm/TRM samples' network by taking the mean value of edge weight for each TF-regulatee pair. Next, regulatees with low variation across TFs (standard deviation <= 1) were removed, then correlation matrix between TFs is calculated by taking account of the SpeArmstrongan's correlation of edge weight for each TF-regulatee pair. R package 'huge' 2 is used to build a graphical model and construct the graph. We employed the Graphical lasso algorithm and the shrunken ECDF (empirical cumulative distribution function) estimator. We used a lasso penalty parameter lambda equal to 0.052 to control the regularization. We chose this value based on the local minimum point on the sparsity-lambda curve. When lambda = 0.05, around 15% of TF-TF pairs are considered as connected in the network. To estimate the false discovery rate, we generated a null model by random shuffling the edge weight of TF-regulatee pair across TFs. When the same algorithm is applied to this dataset, the chosen cutoff identifies zero interaction, suggesting that the method with cutoff equal to 0.05 has a very low false discovery rate.
Circle: TF-specificity Green: TRM-specific Brown: TEXterm-specific
Line thickness: TF-TF interaction intensity
Line color: Green: TF-TF interaction found in TRM, Brown: TF-TF interaction found in TEXterm
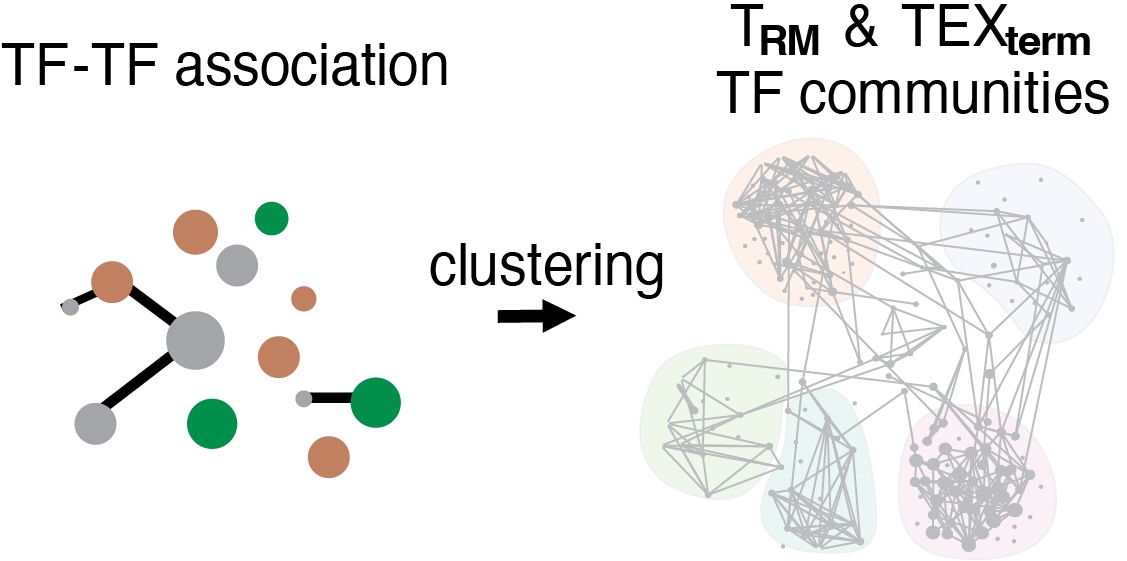
Communities were detected using Leiden algorithm 3 with modularity as objective function and resolution as 0.9 since it reached the highest clustering modularity. In total, we identified 5 communities for each context. Network visualization was performed by graph with Fruchterman-Reingold layout algorithm 4 utilizing R package 'igraph' (https://r.igraph.org/).
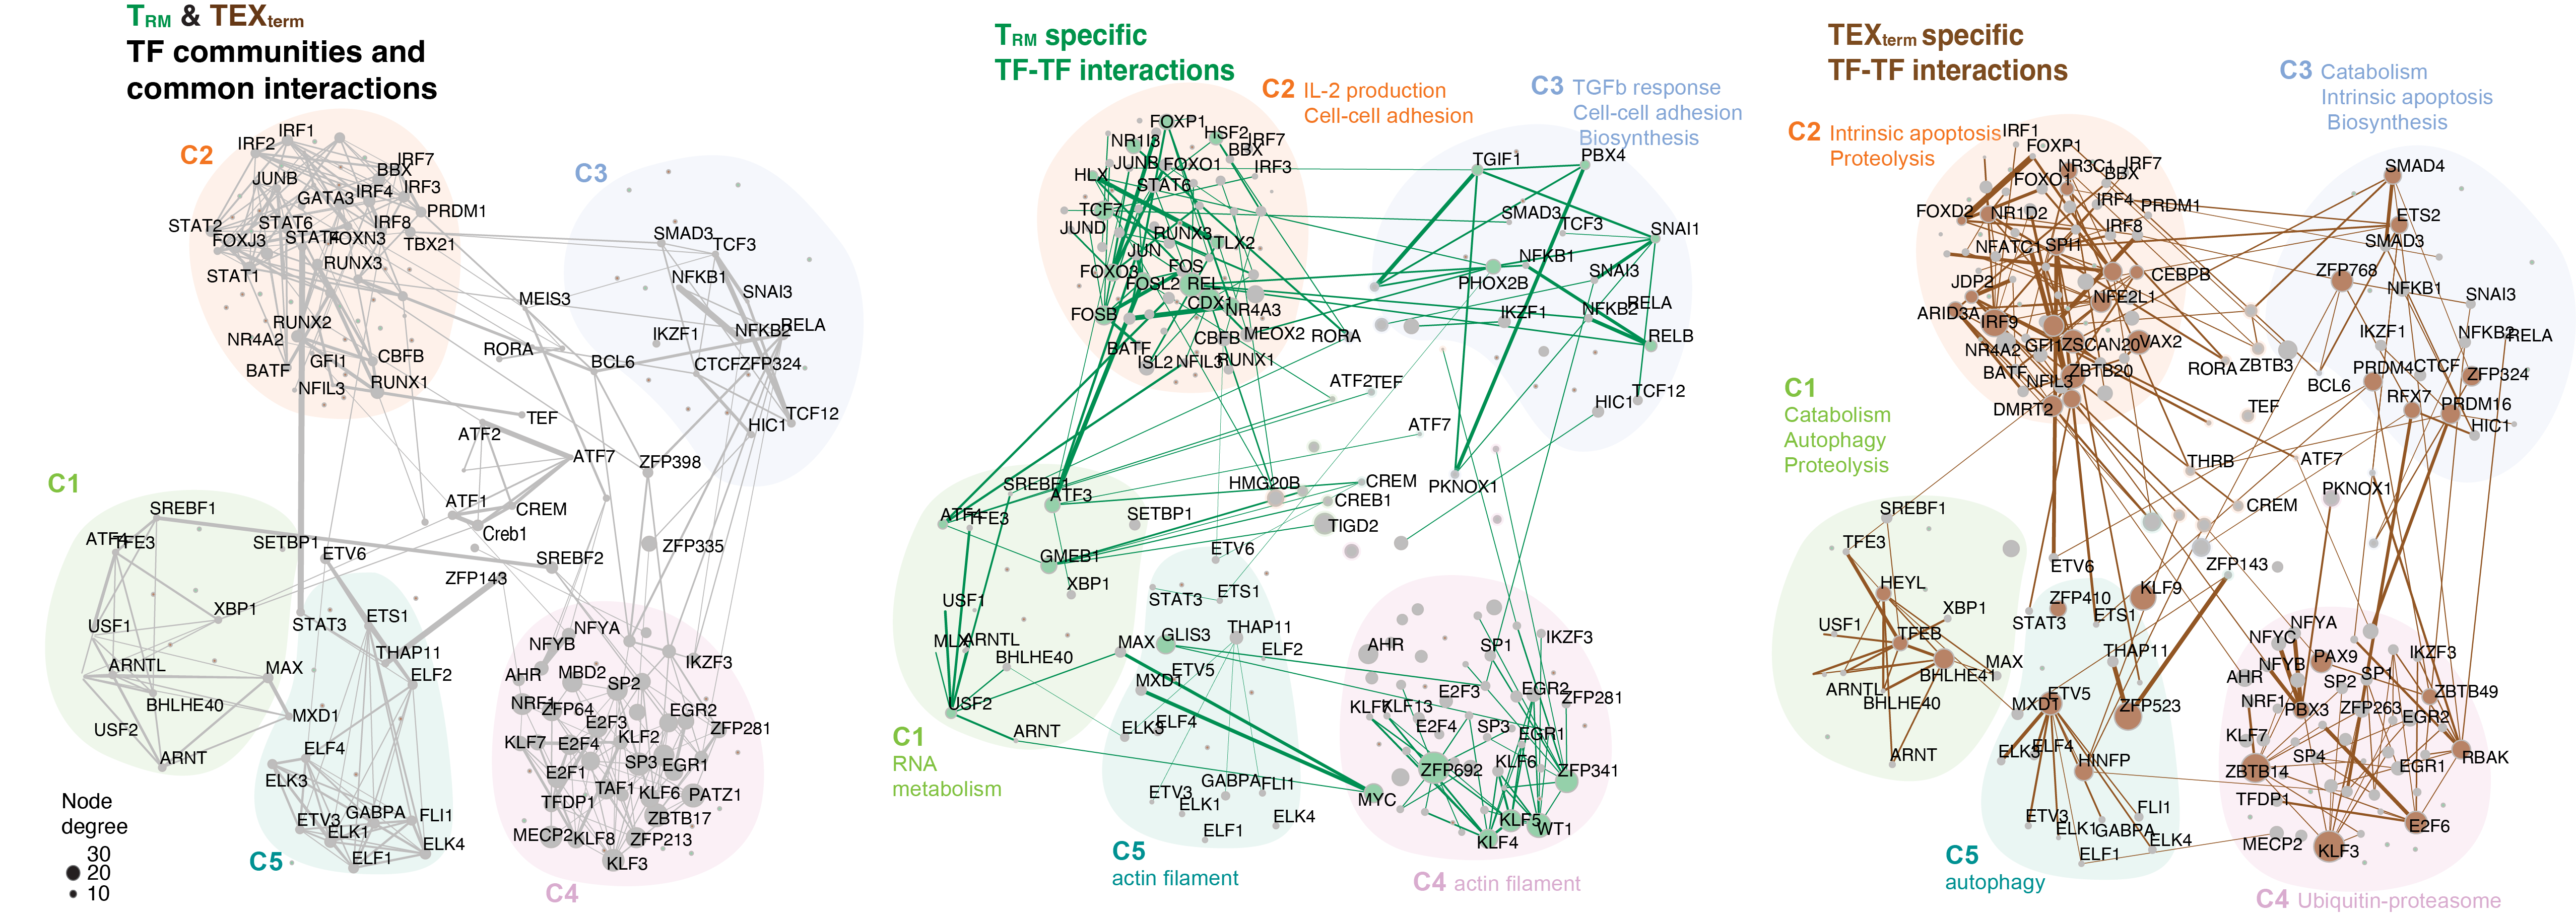
TF-TF association clustering generates five TF communities between TRM and TEXterm cells. Left: The overall community topology is shaped by shared TFs (gray) in both TRM and TEXterm cells. Middle and Right: TRM and TEXterm cells show differential TF-TF interactions within each community and between communities. Top 10% of interactions are shown. The line thickness represents the interaction intensity.
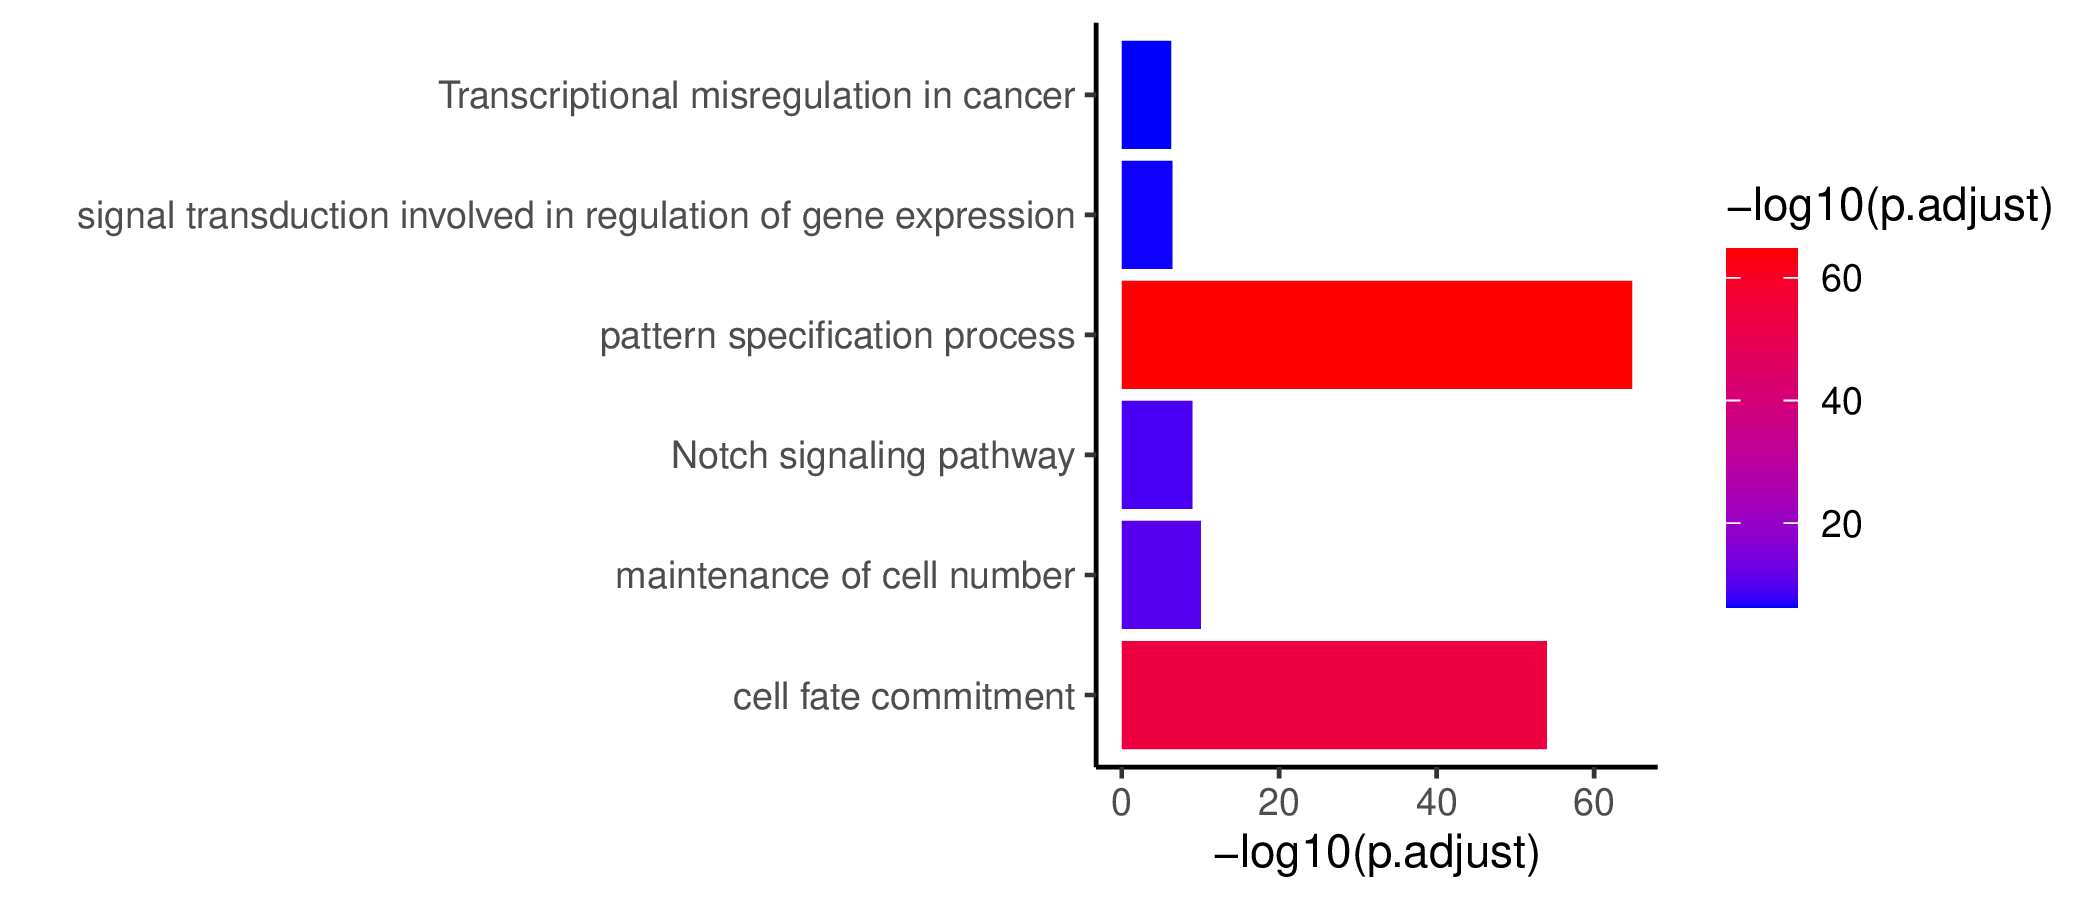
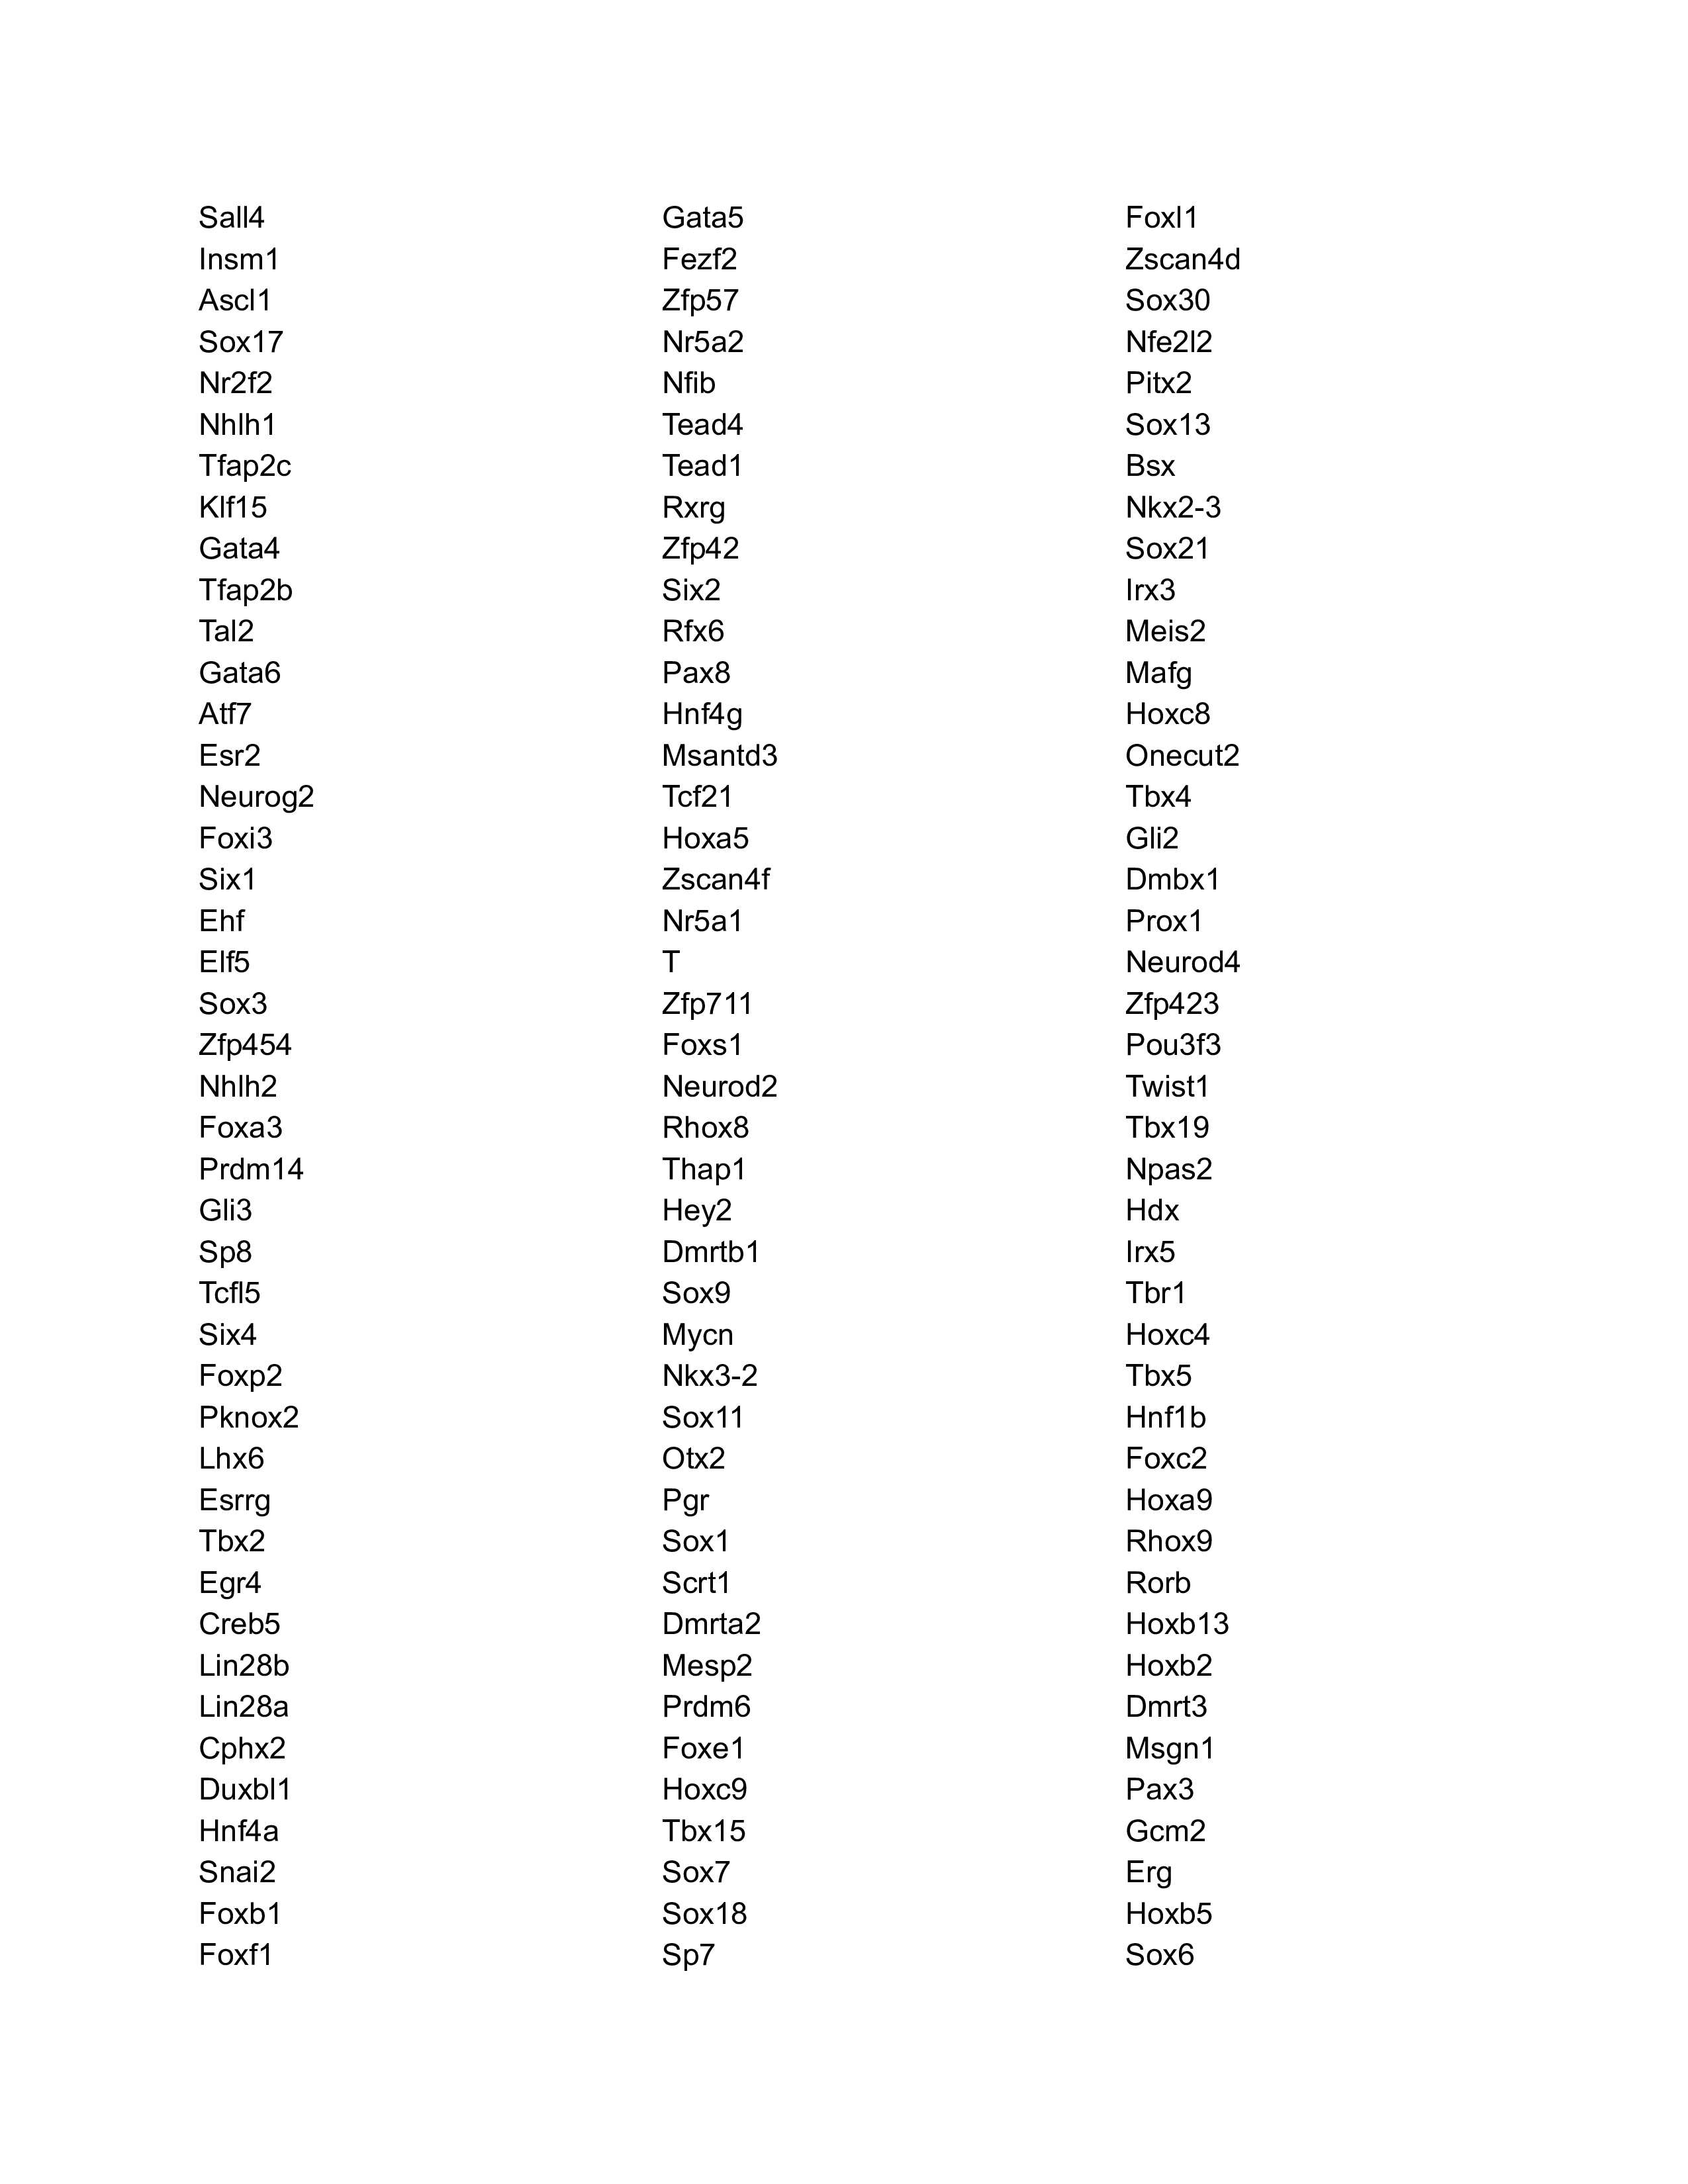
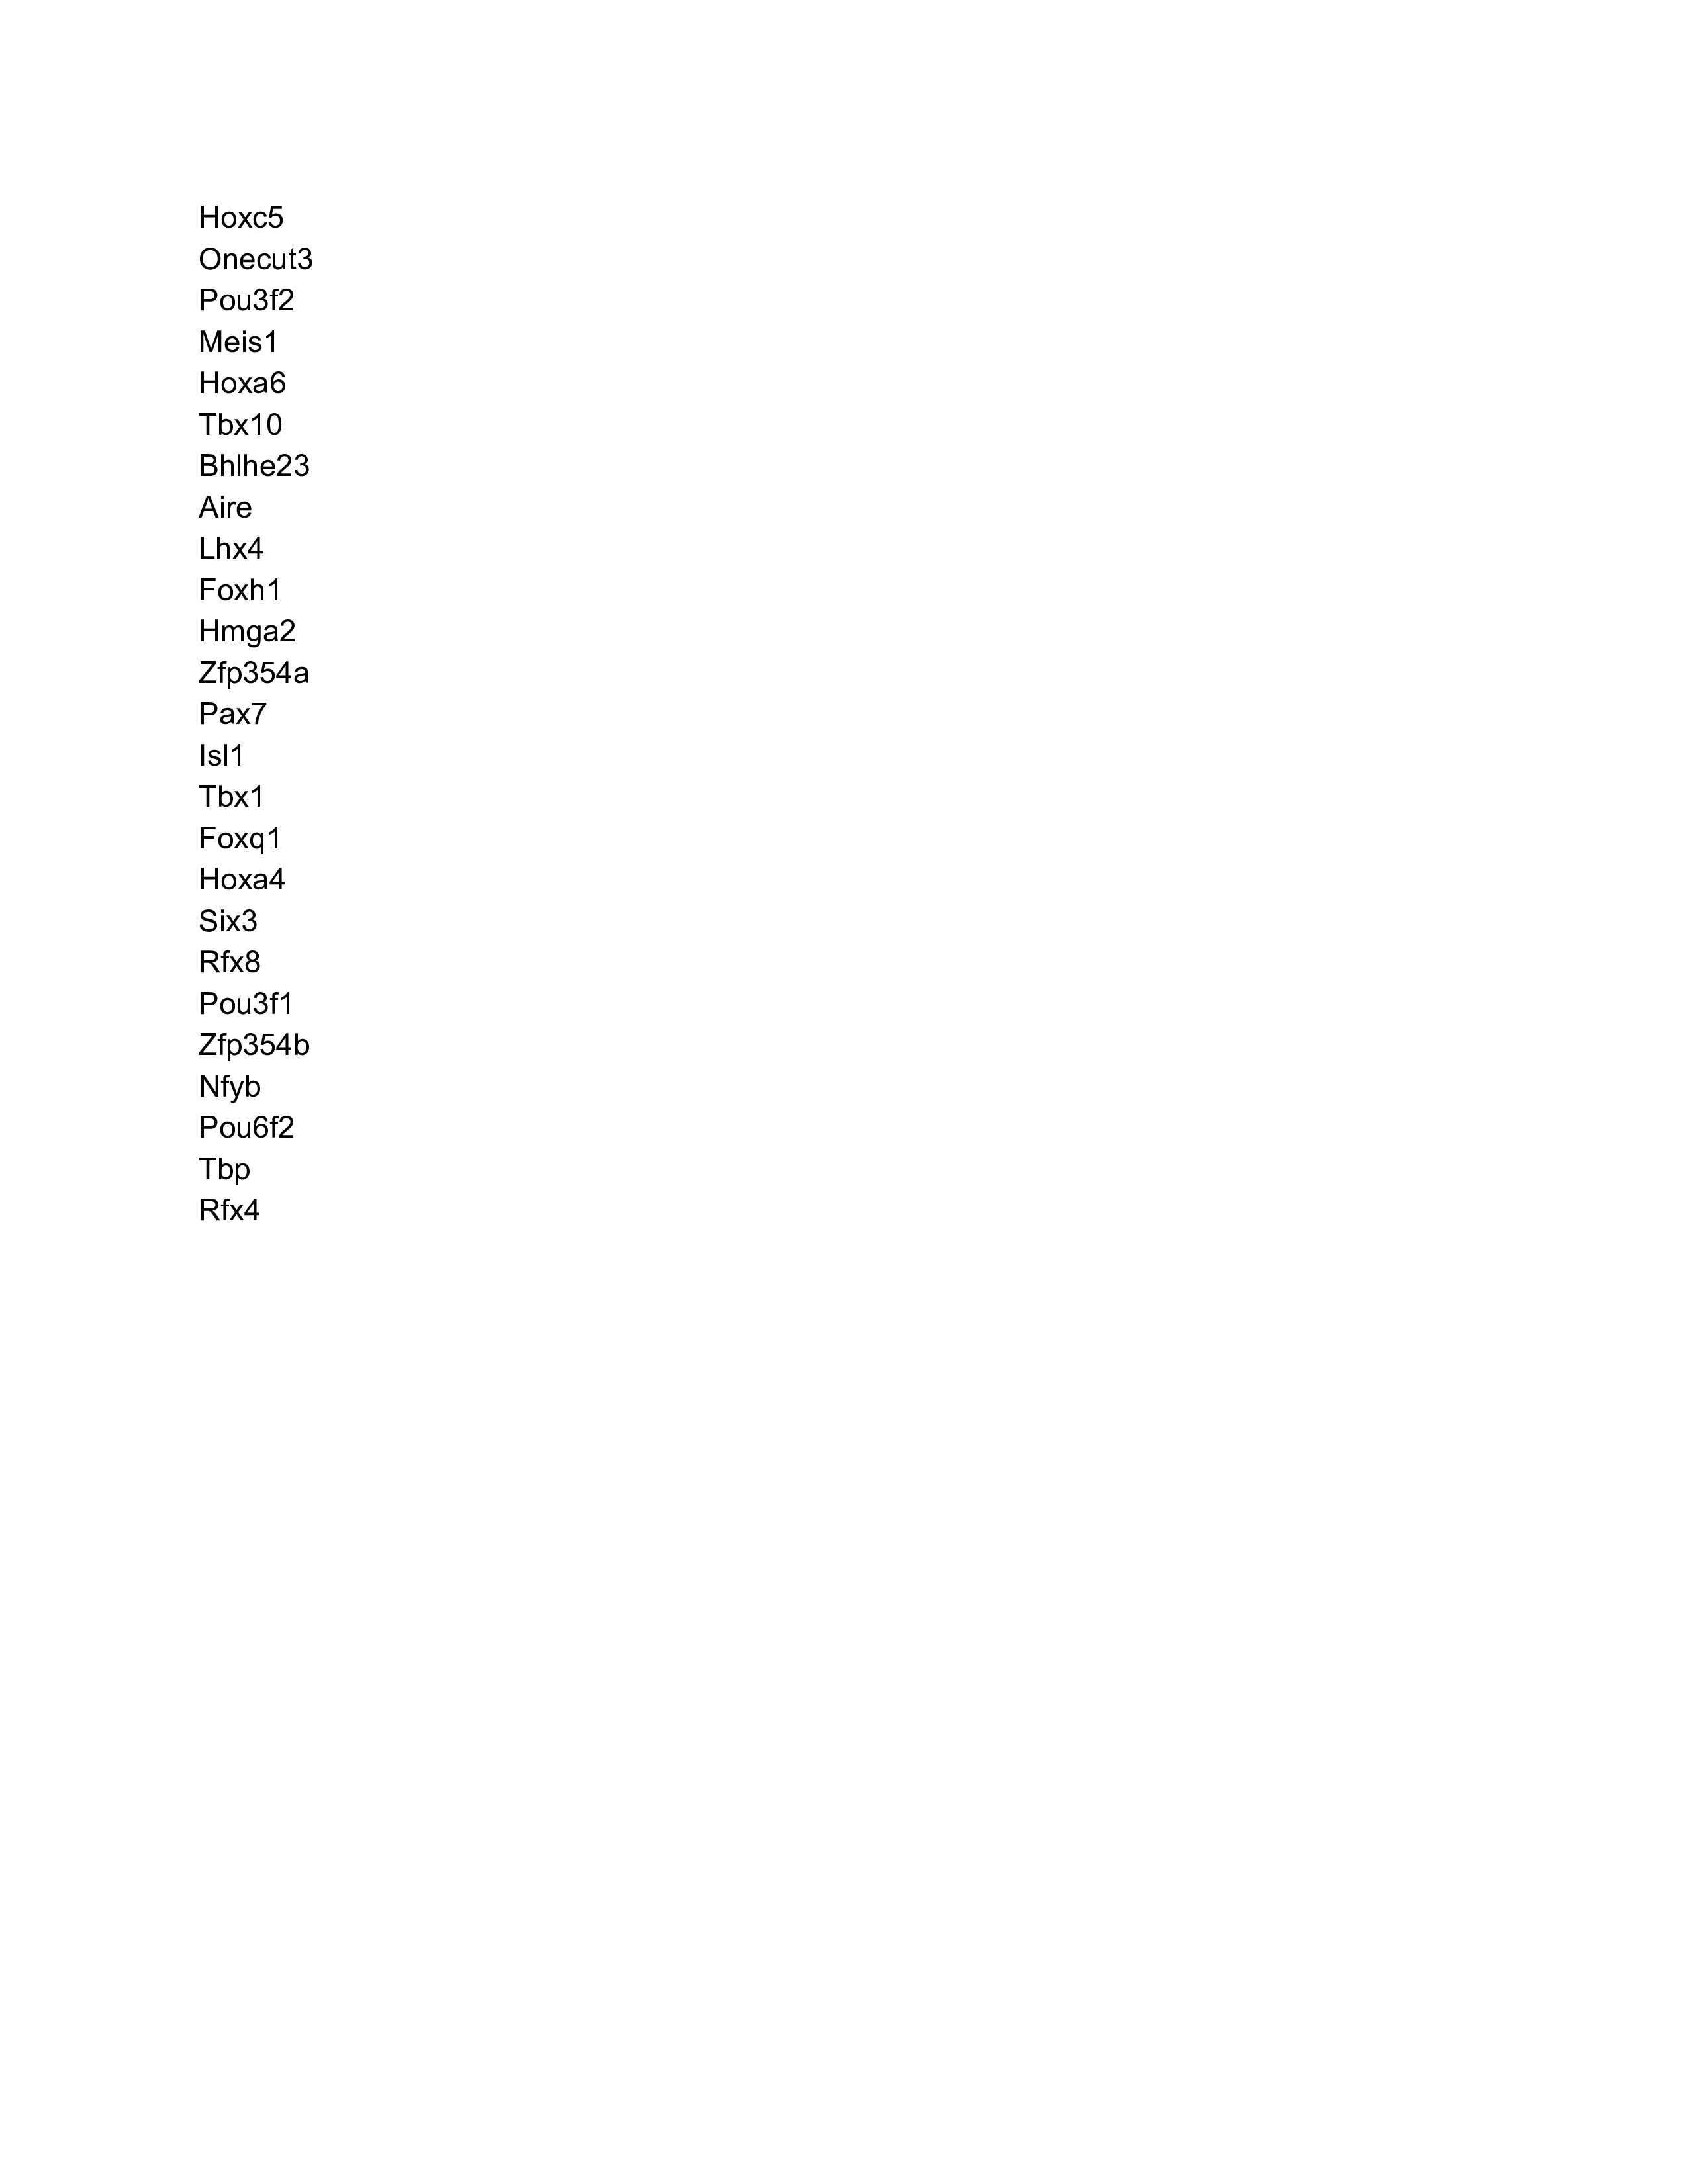
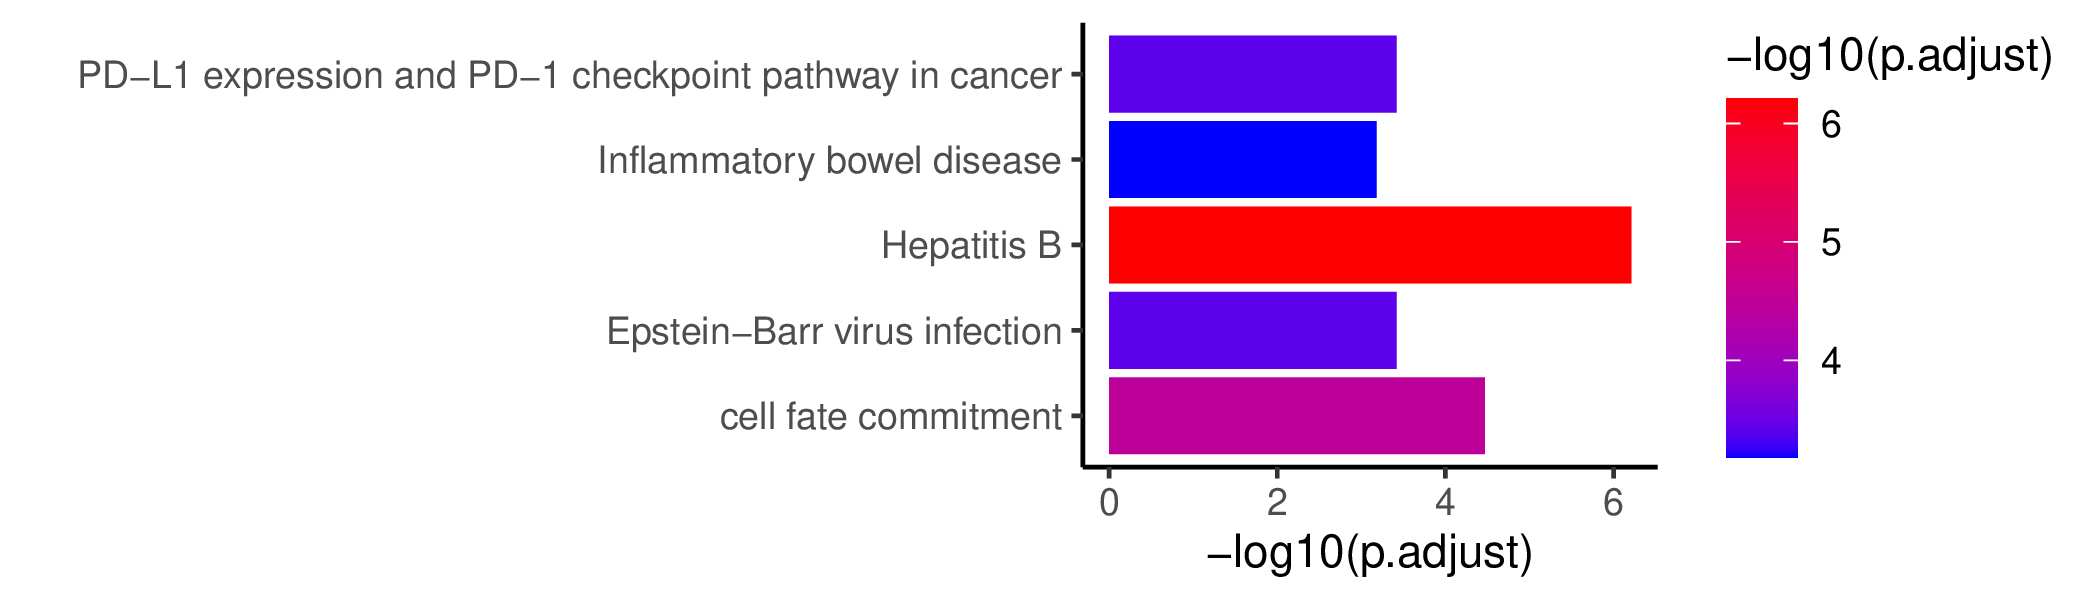
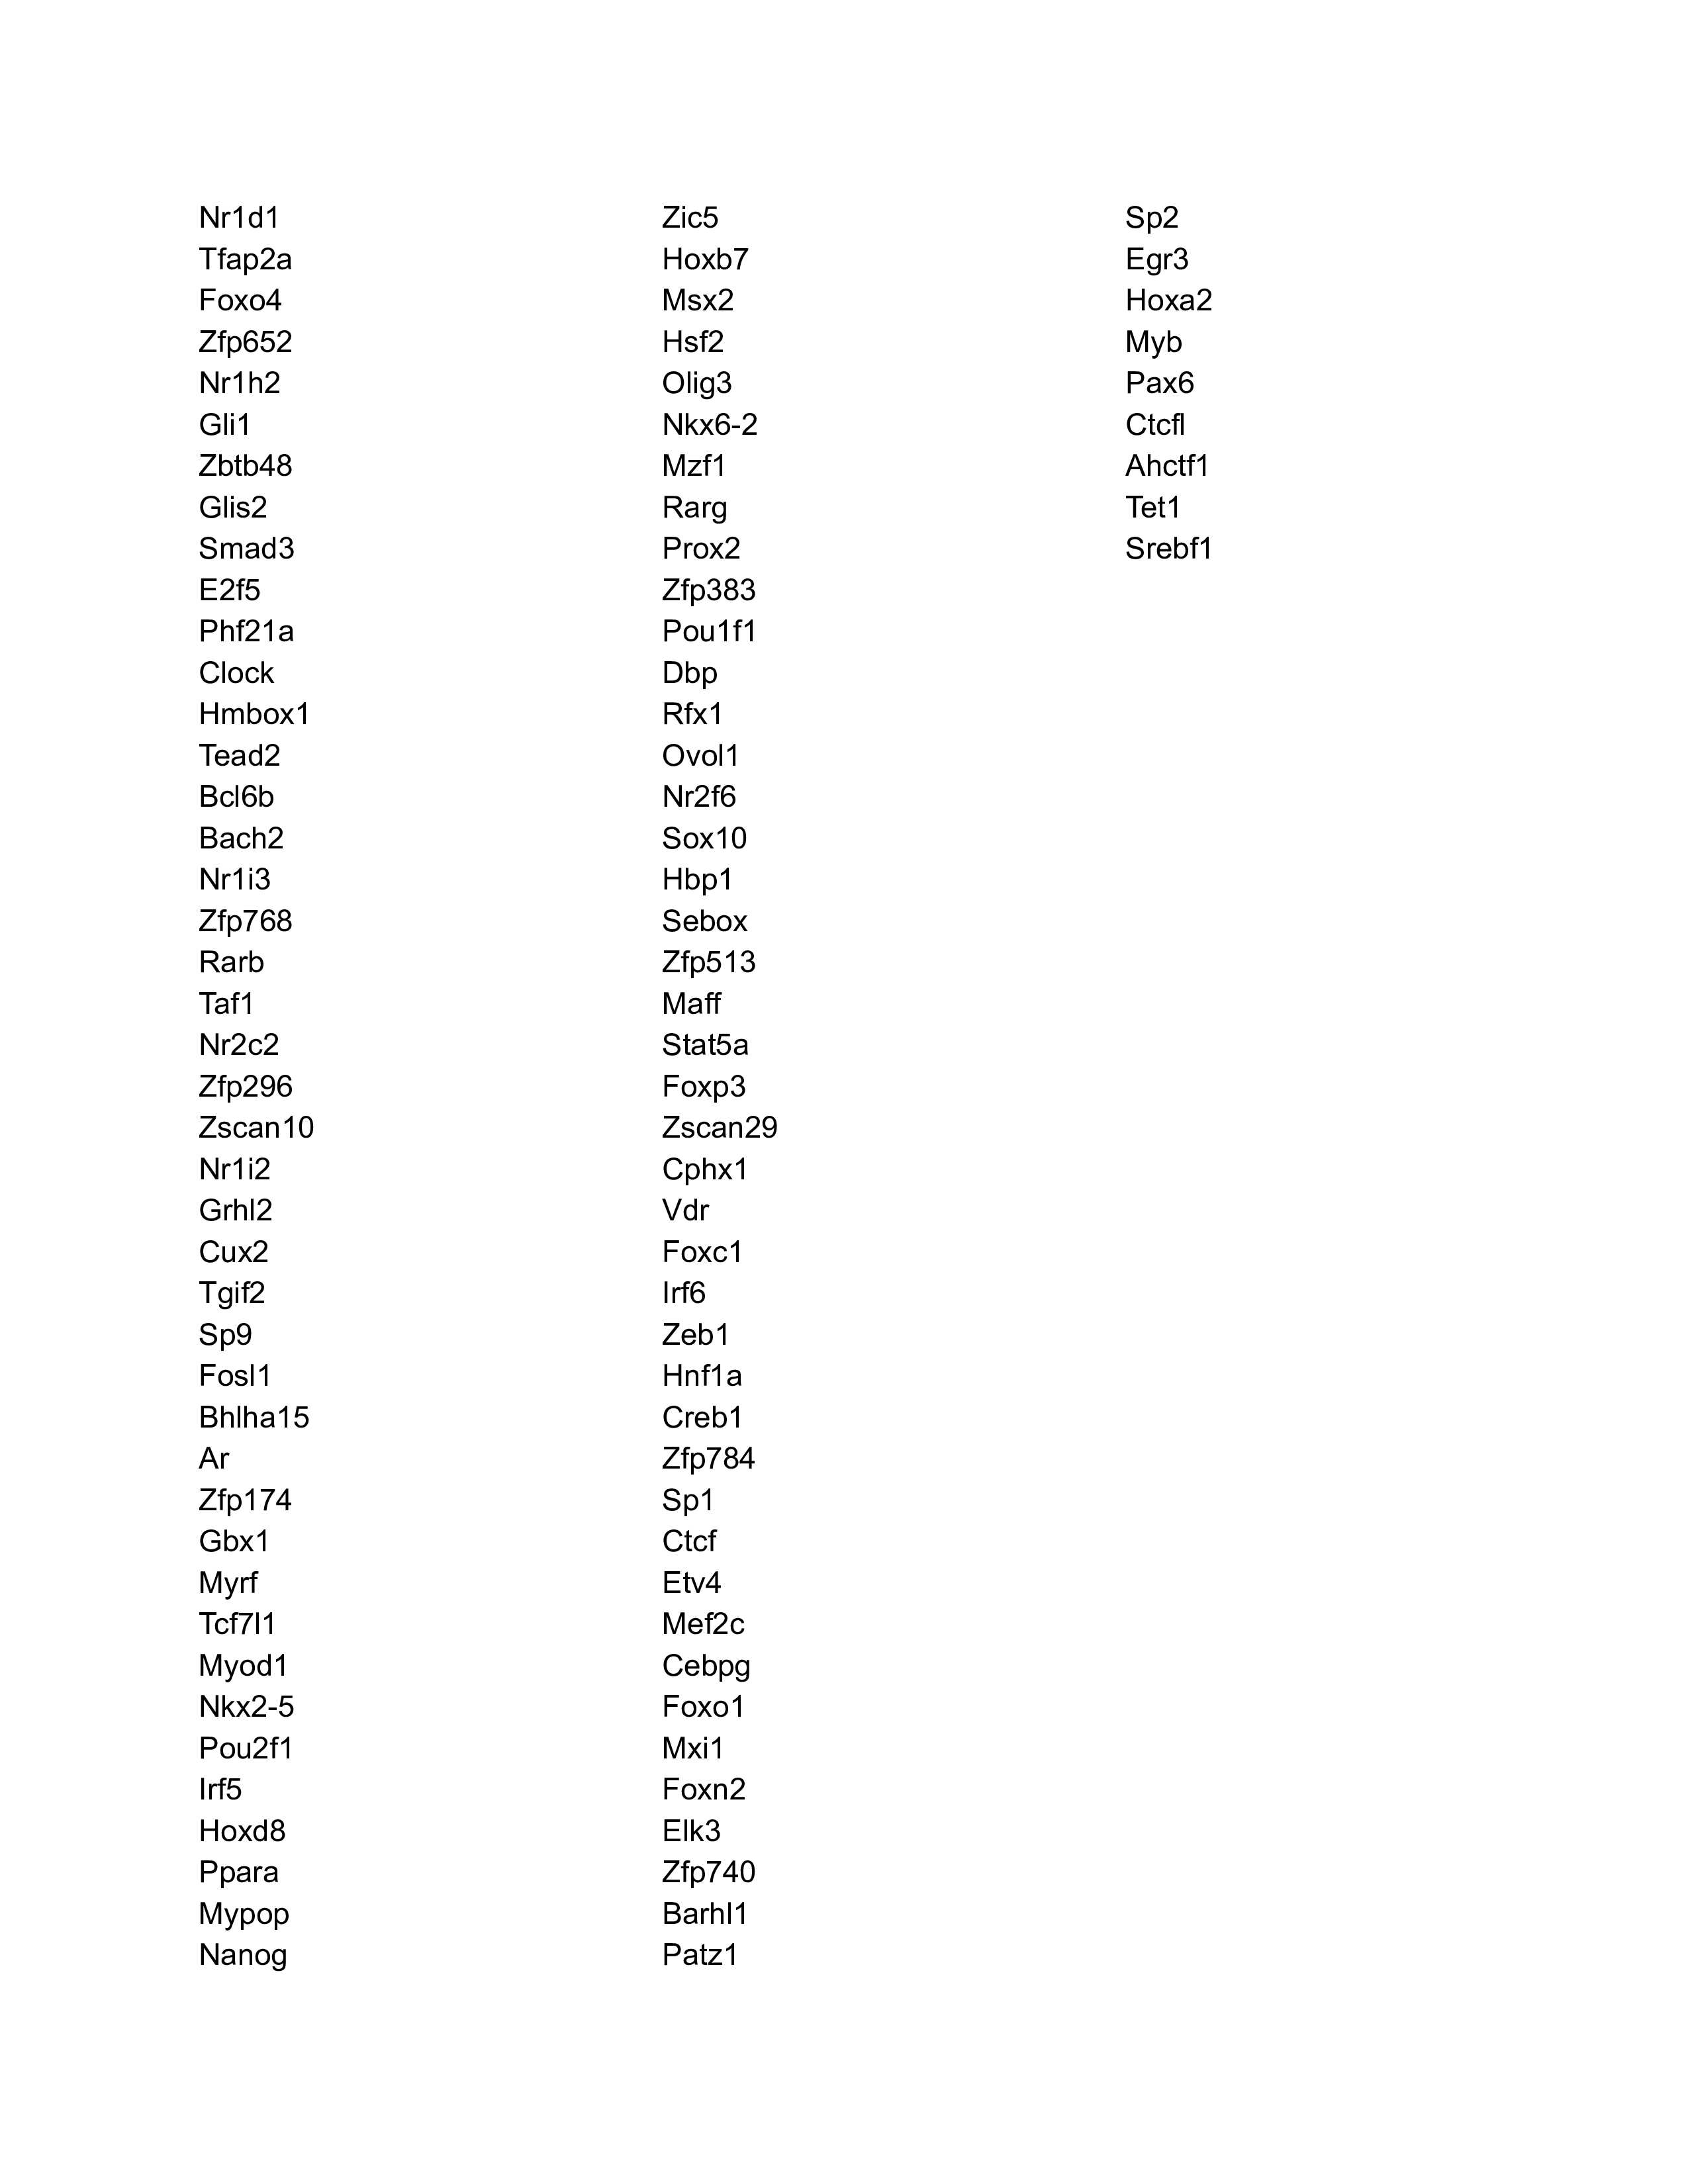
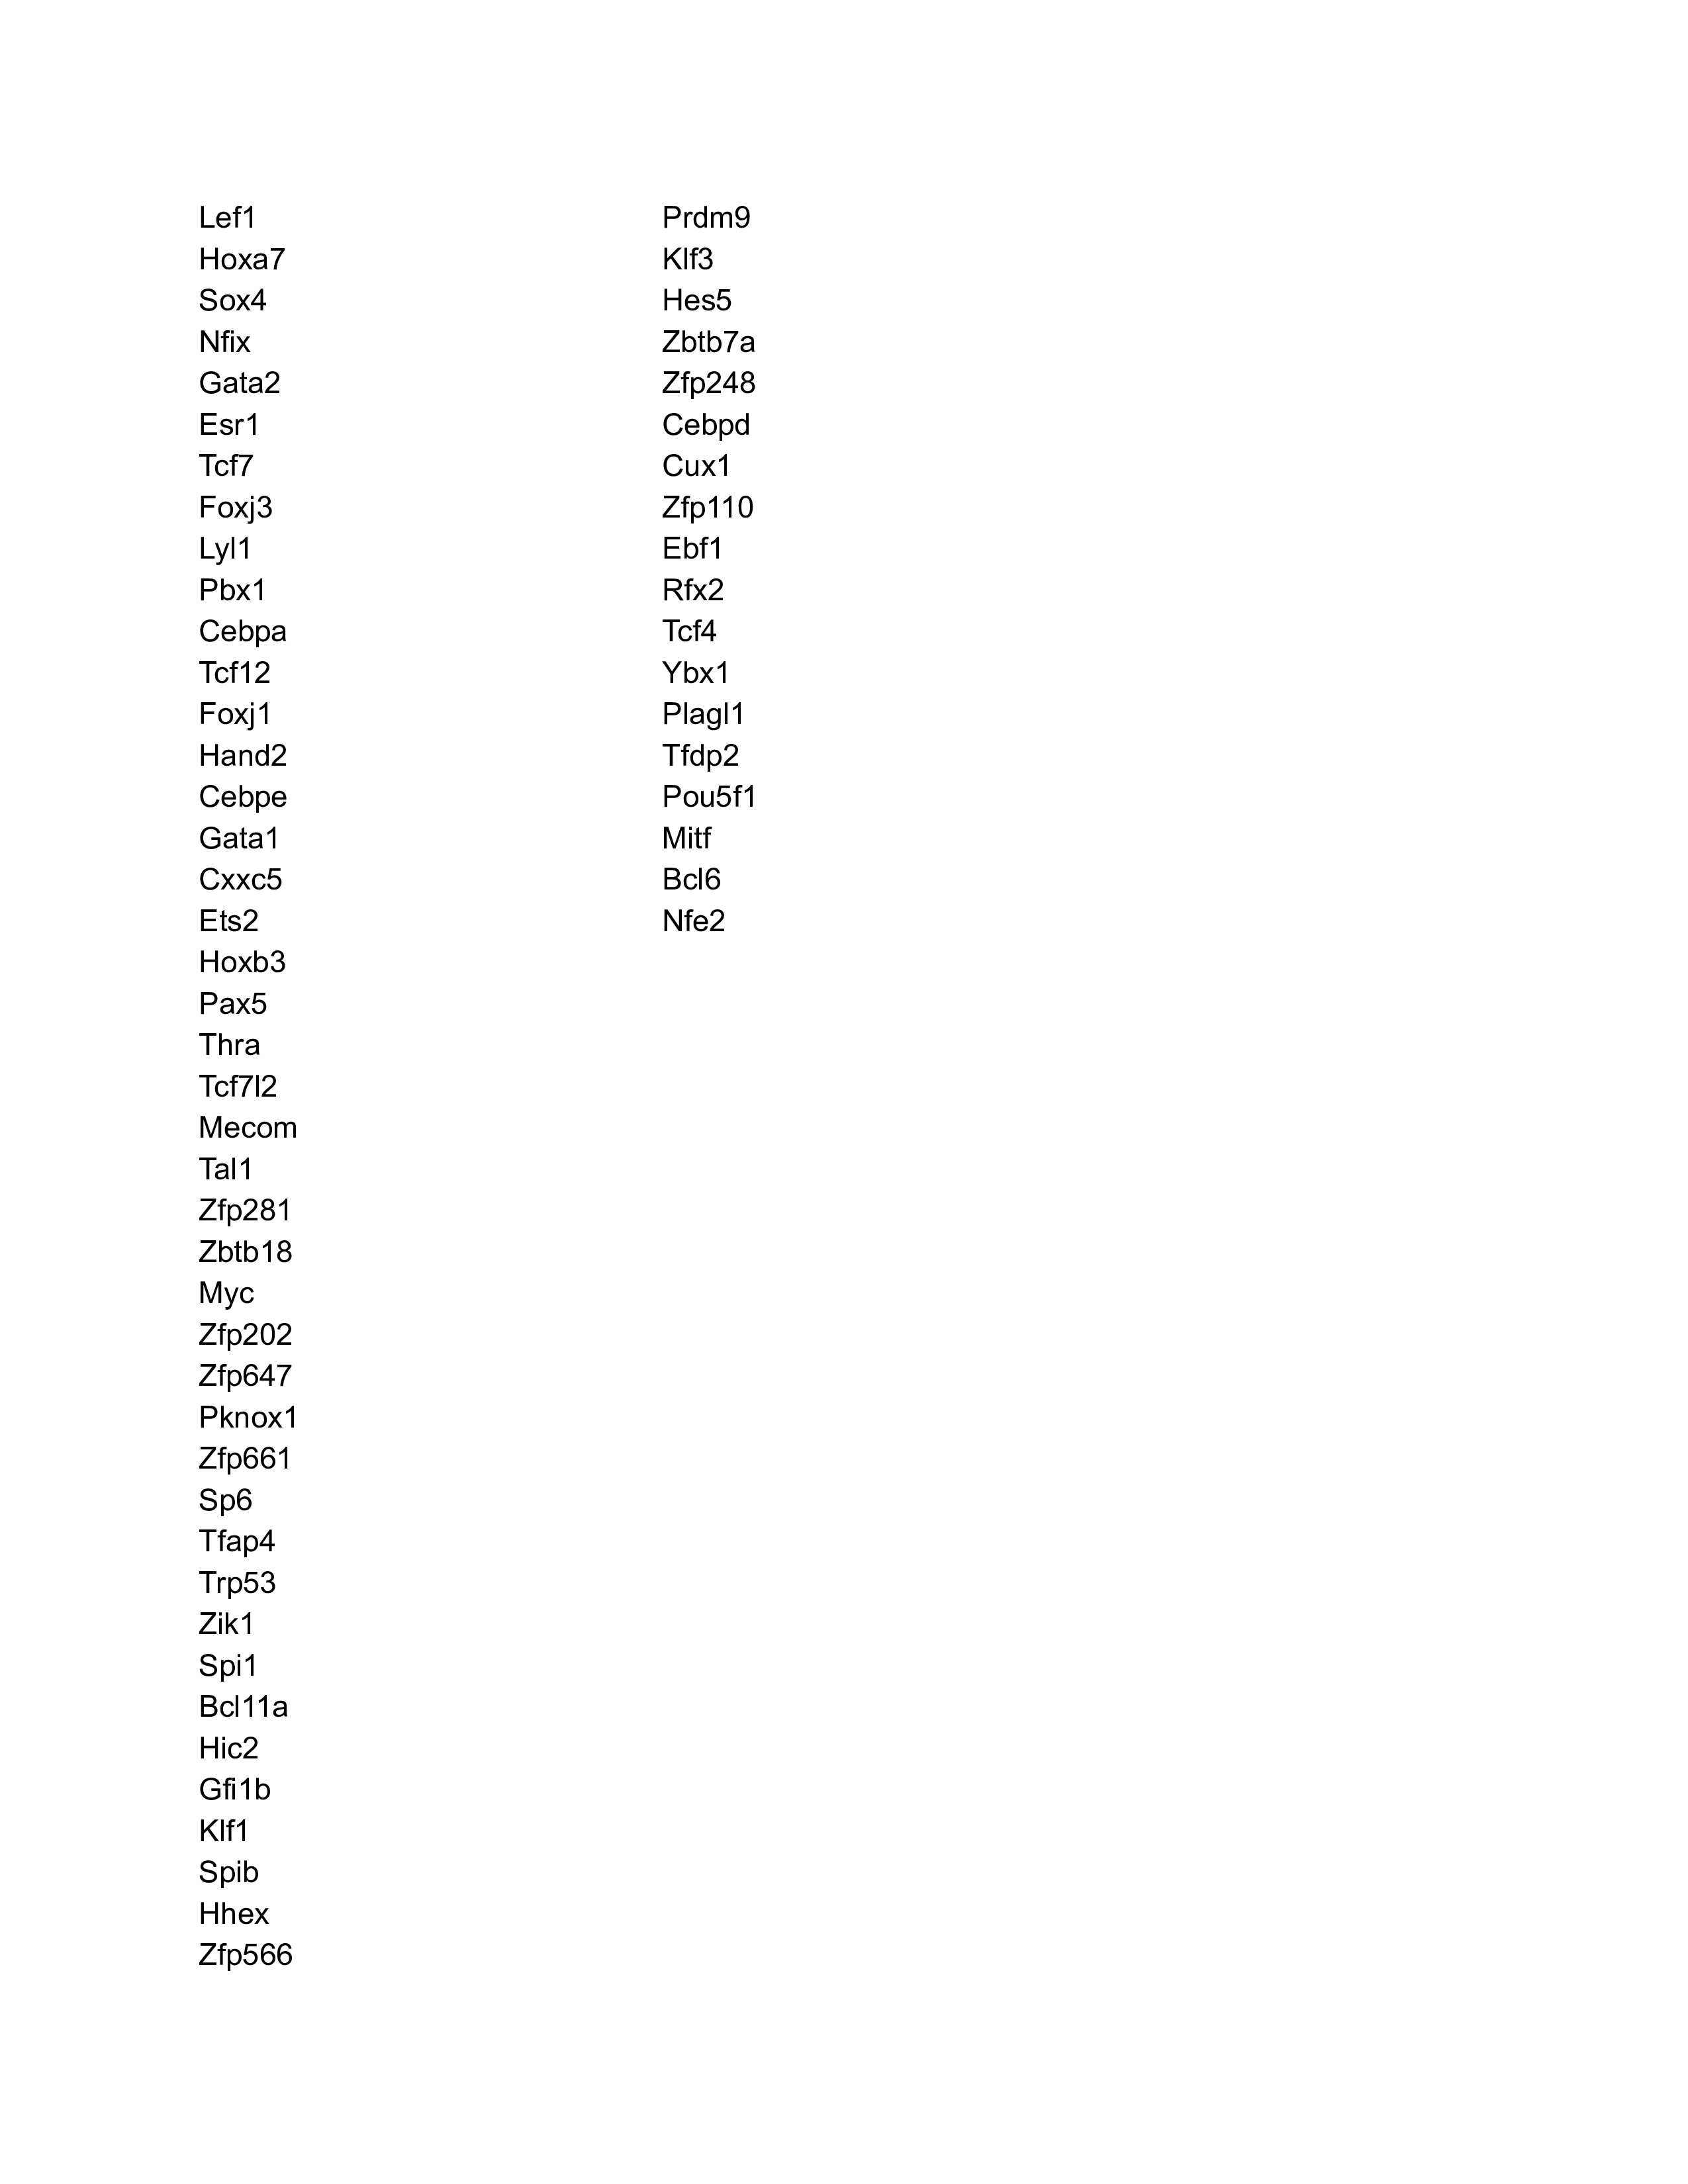
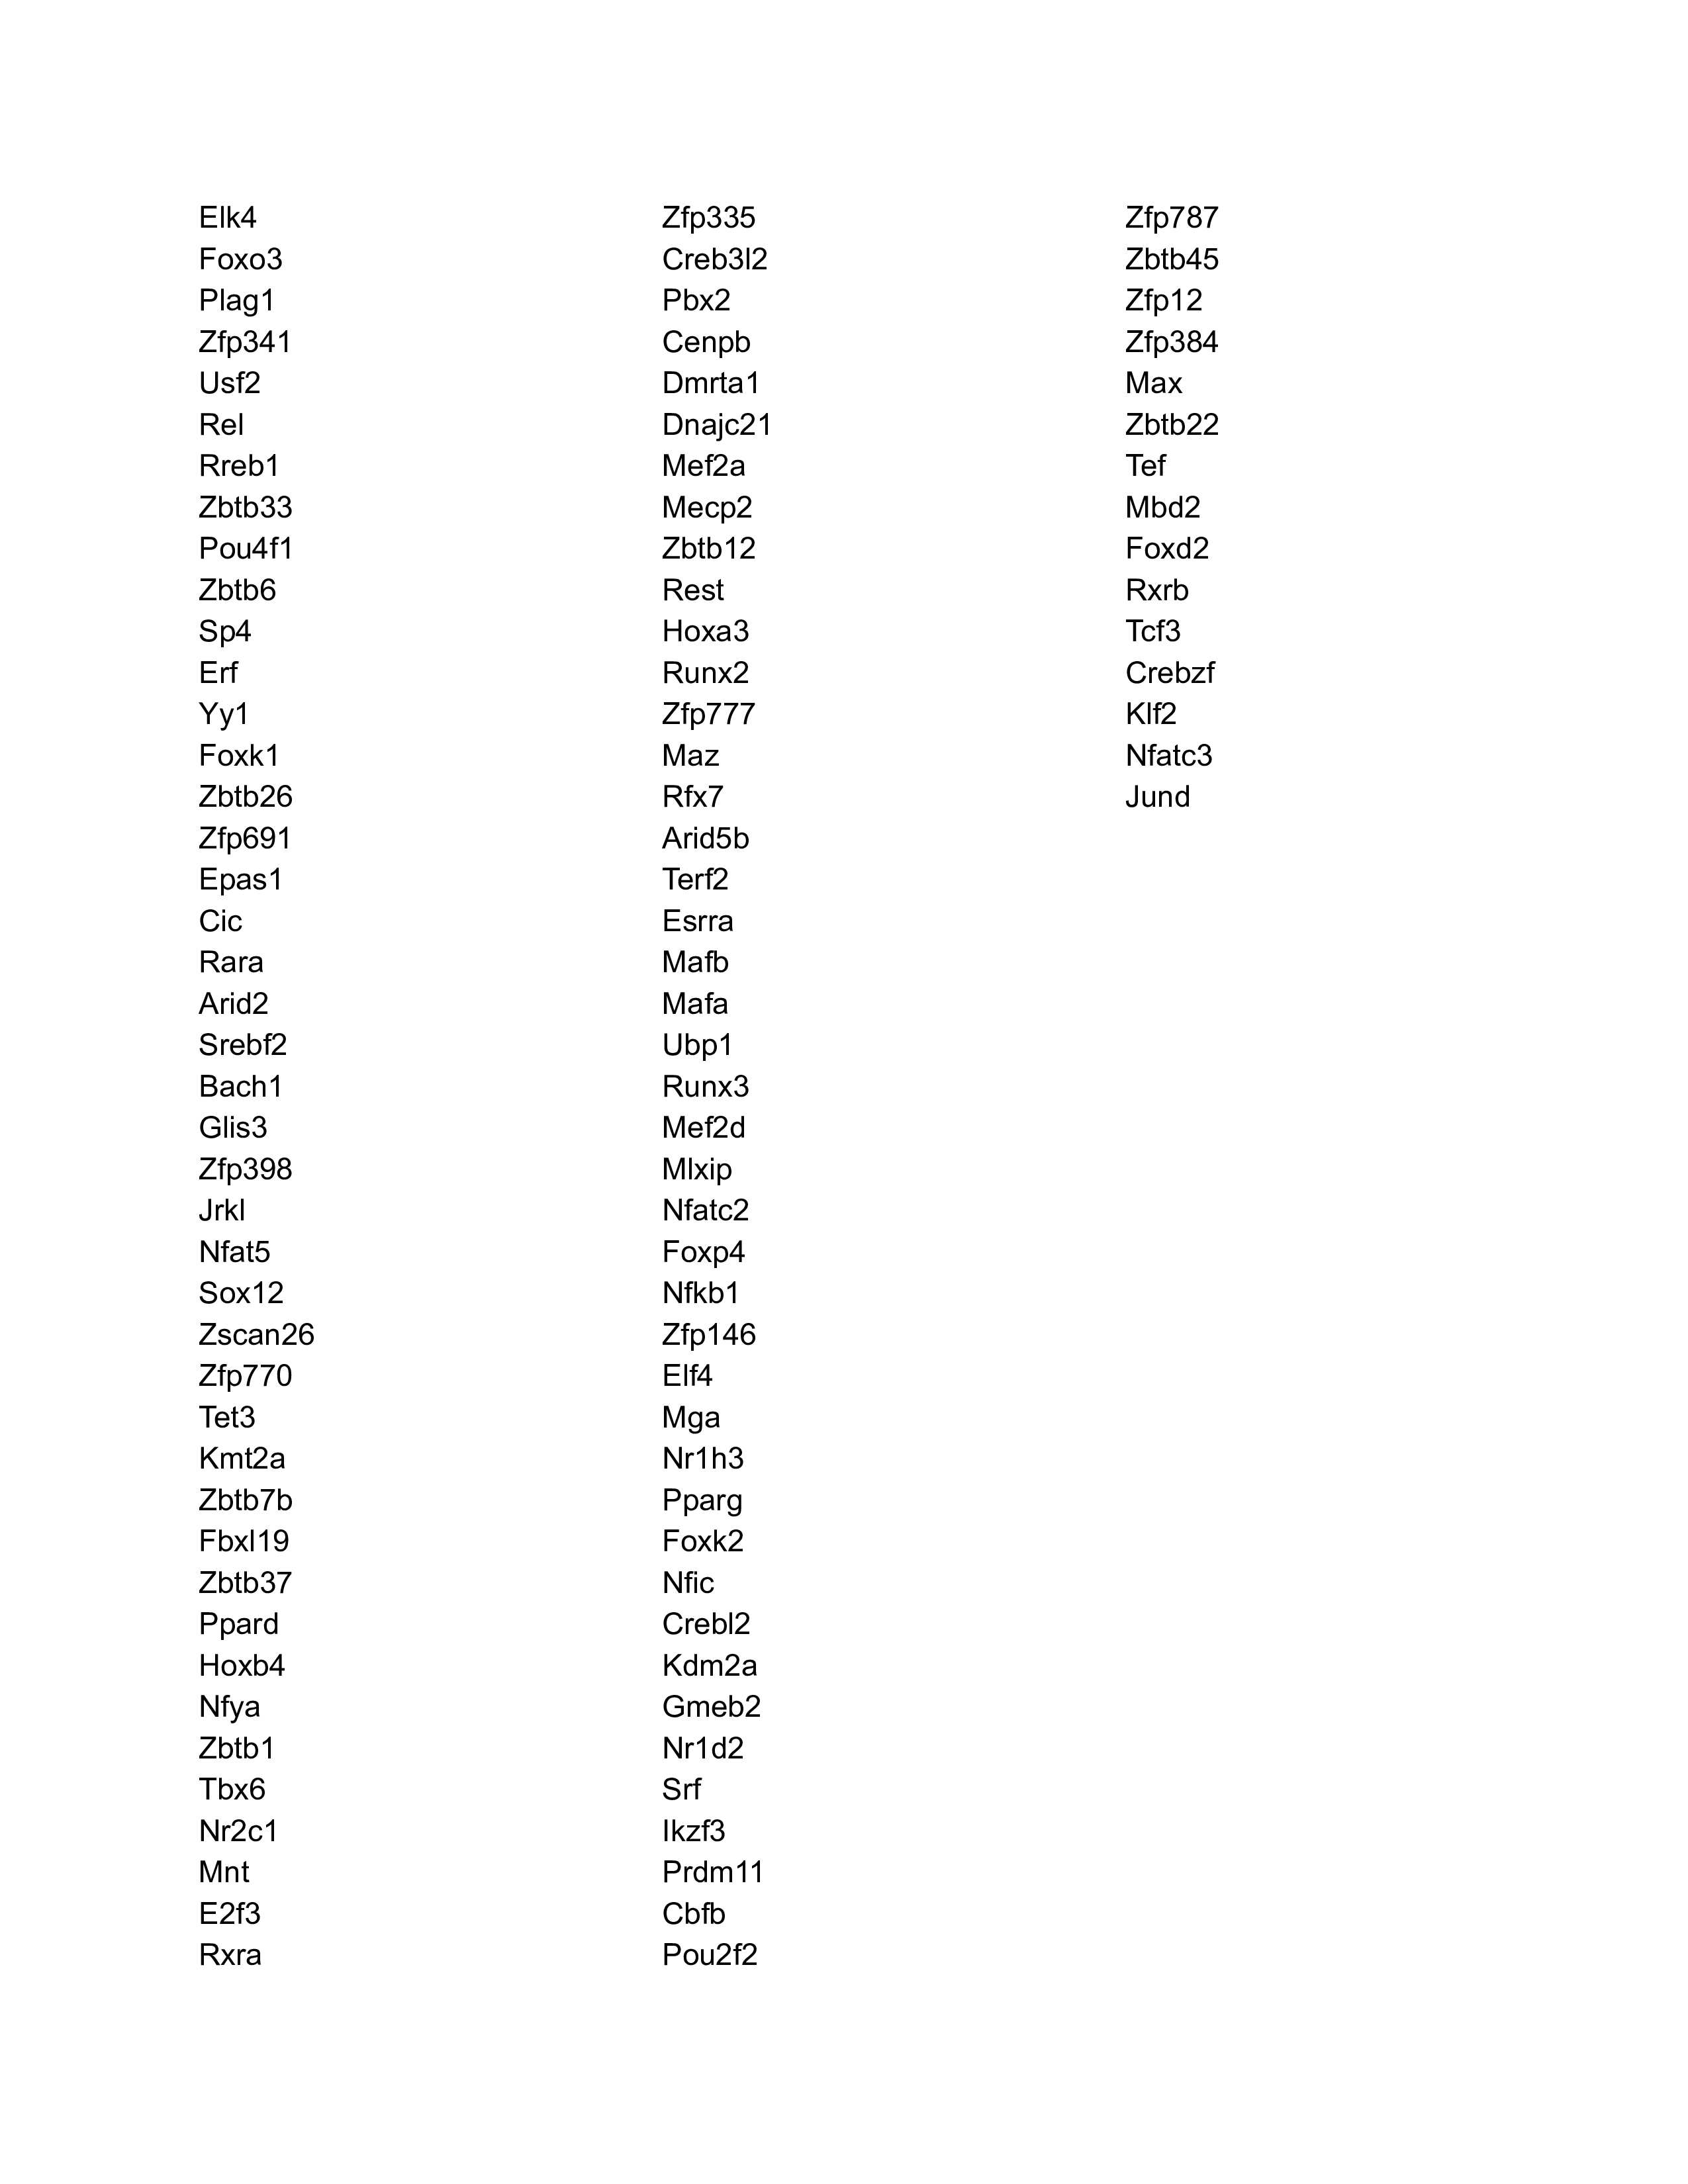
Members of each TF community in each cell state are below:
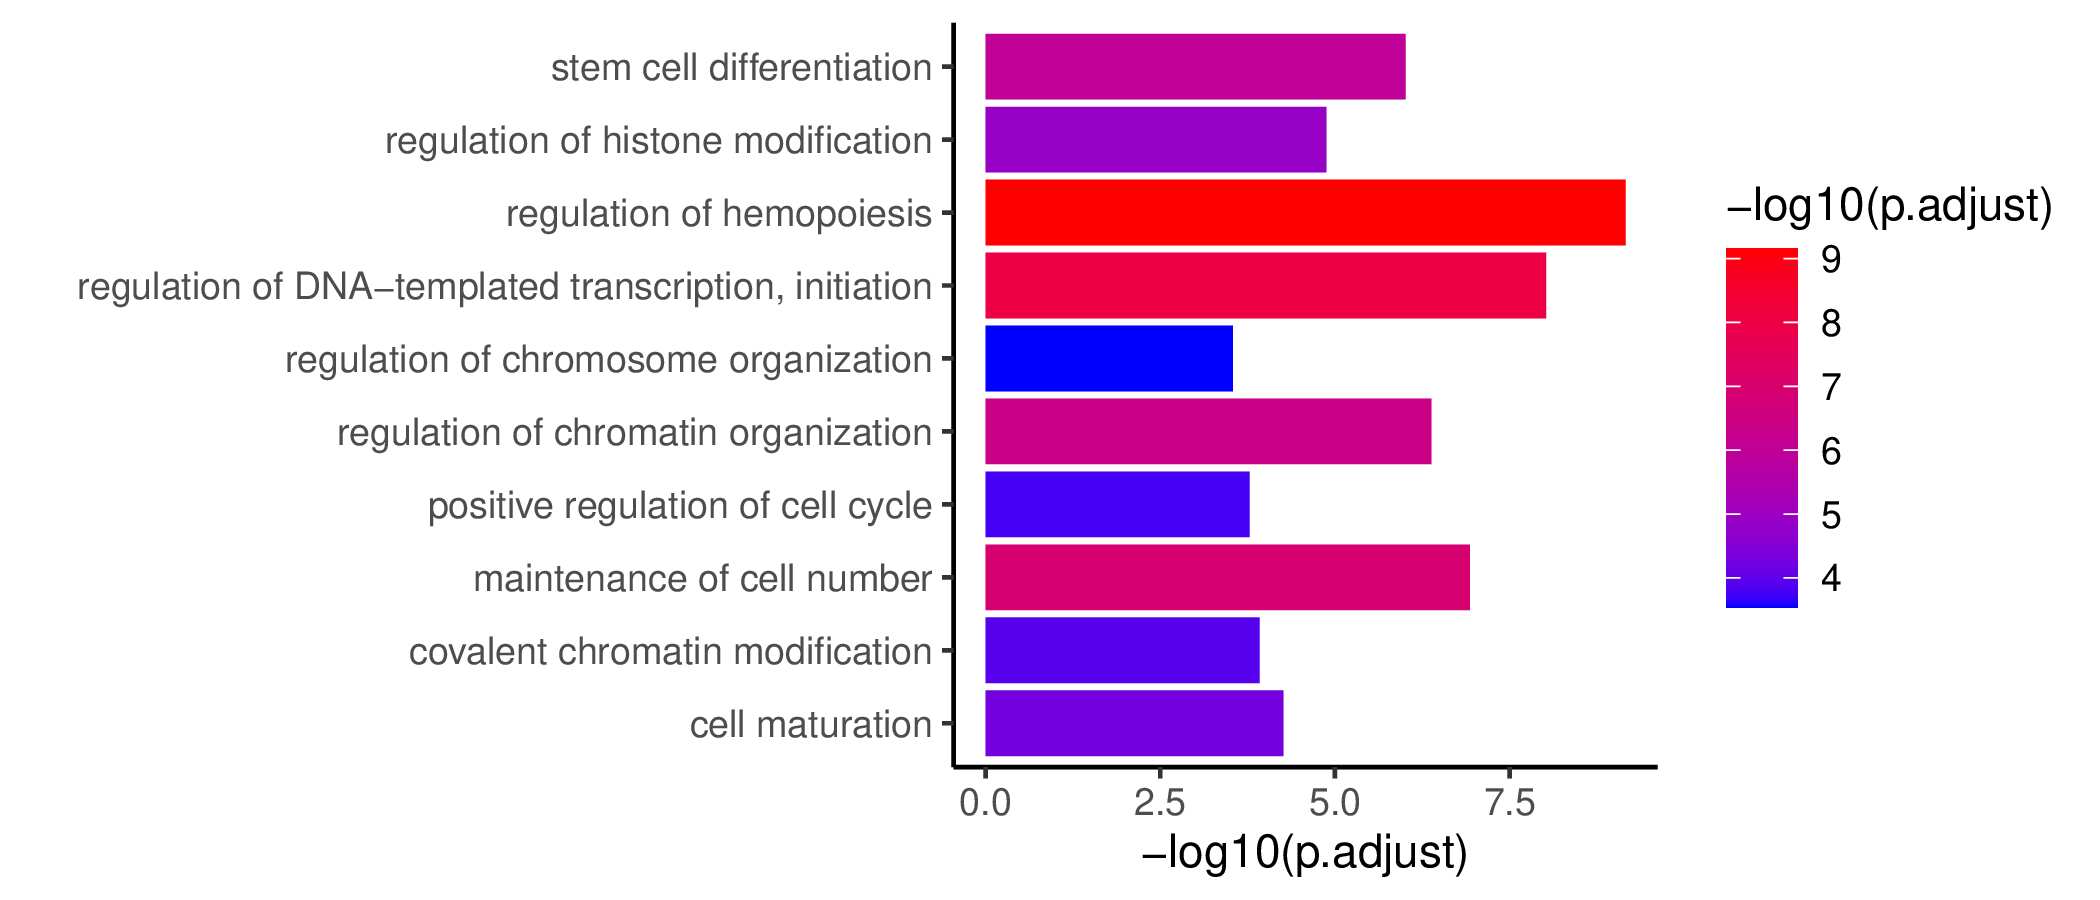
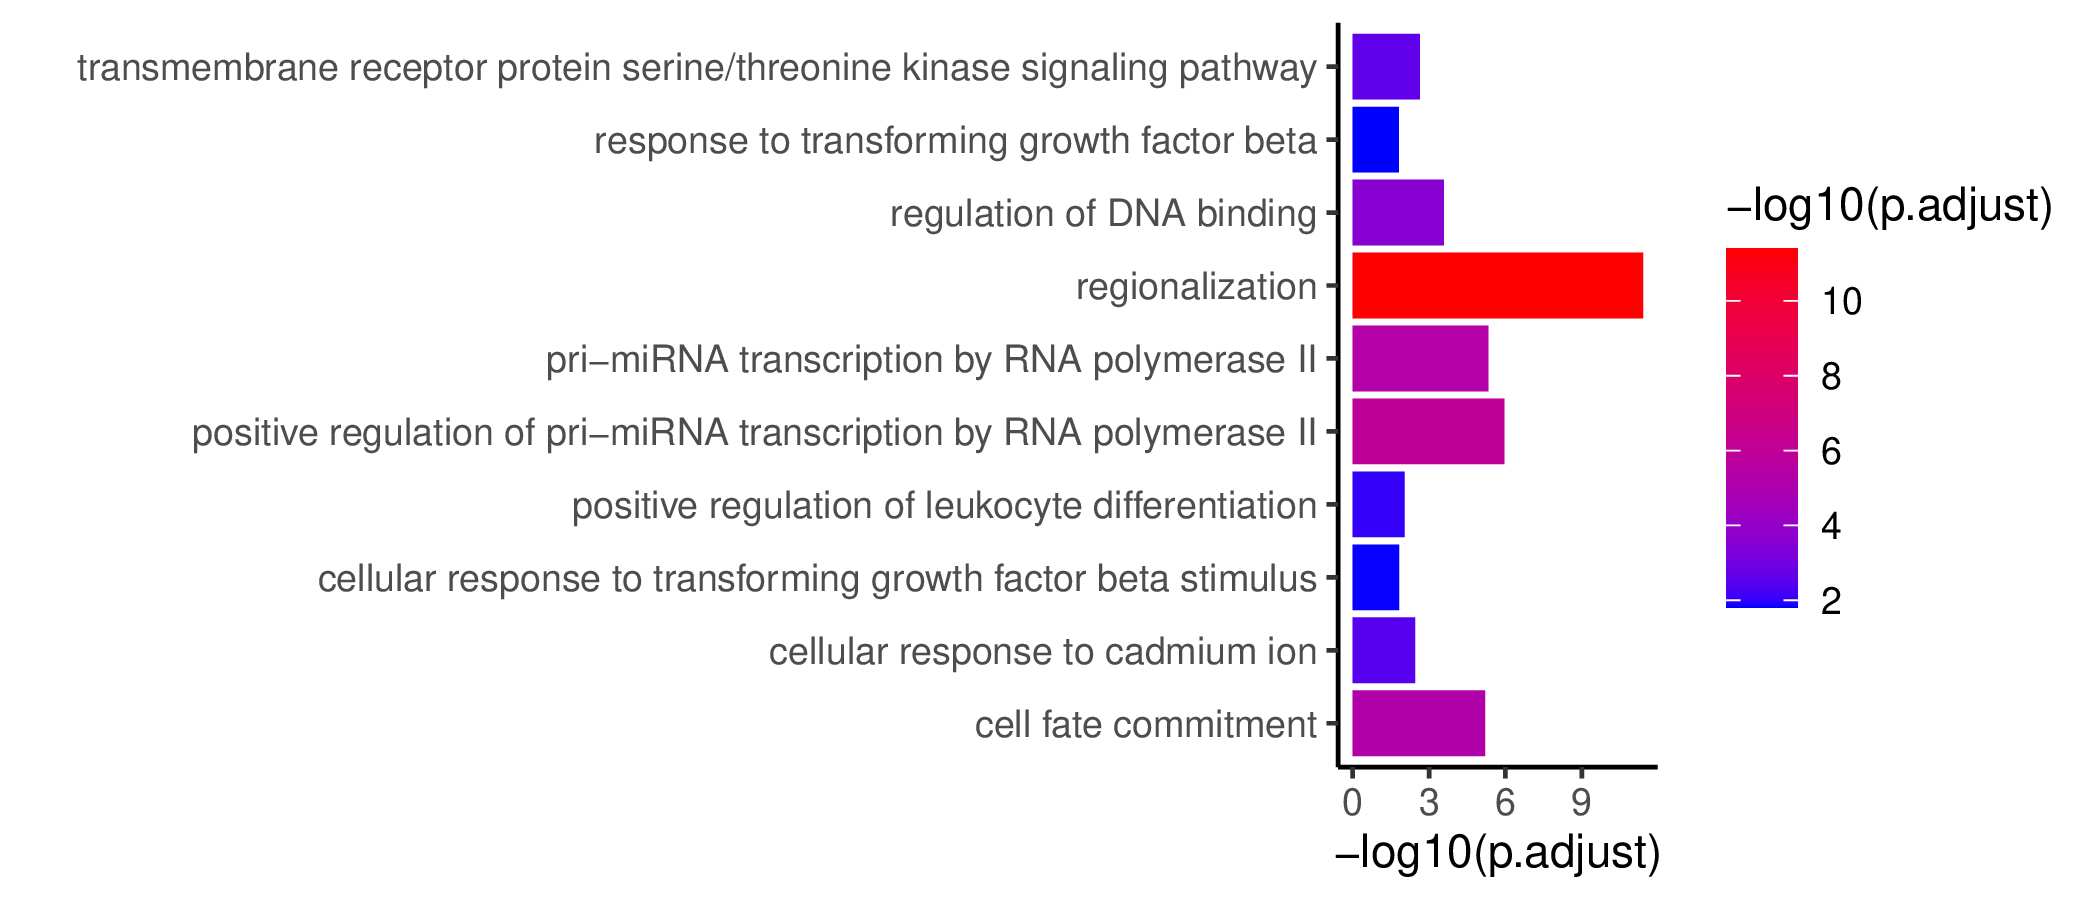
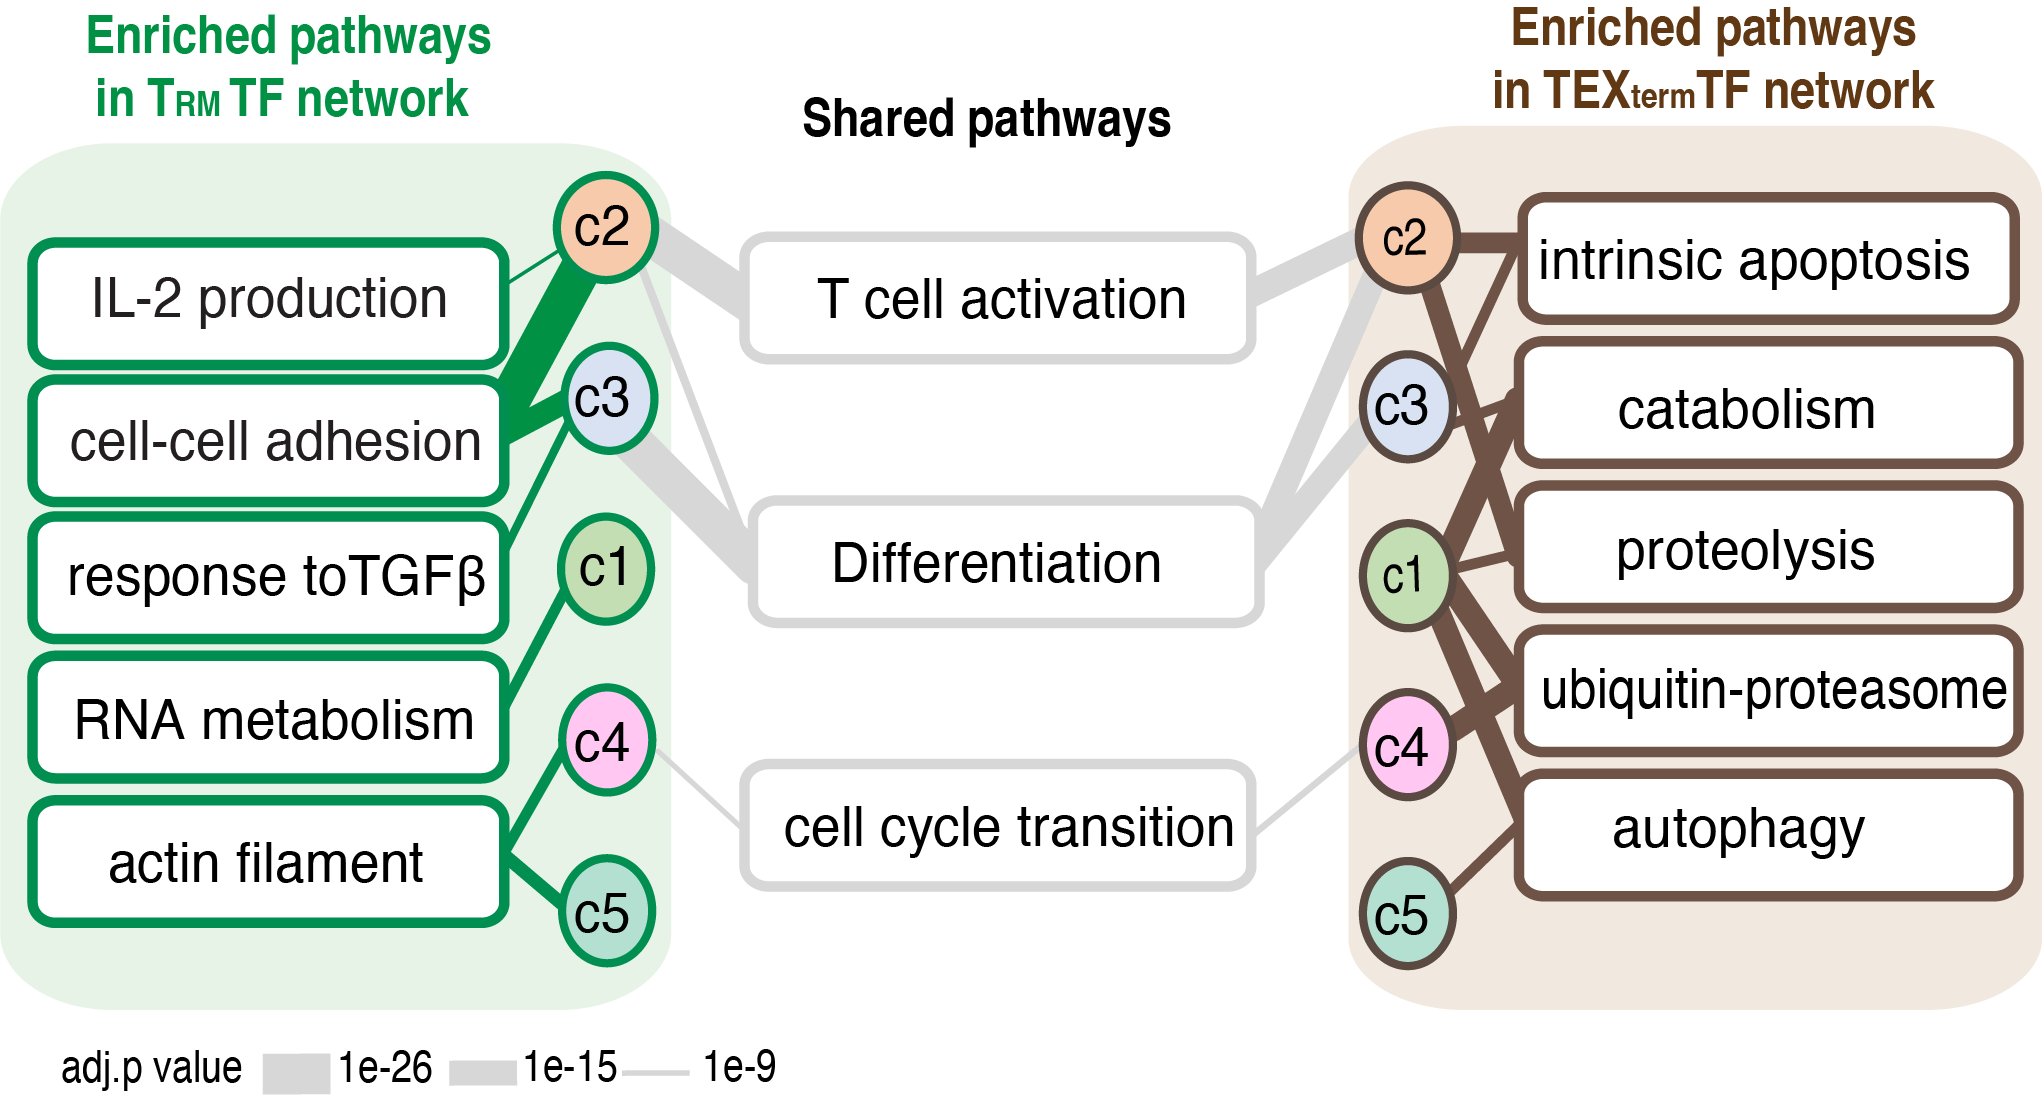
TF neighbor communities in TEXterm and TRM cells, respectively are linked to different biological processes (below) The overall topology of these communities was influenced by multi-state TFs active in both cell states, while cell state-specific TFs created unique interaction patterns between the communities. Pathway analysis of the regulatees in each community suggested that TRM- or TEXterm-specific TFs within each community controlled different biological pathways. For example, in TRM cells, community 3 was associated with cell-cell adhesion and response to TGFβ, and community 1 was associated with RNA metabolism, but in TEXterm cells, community 3 was linked to apoptosis, and community 1 was coupled to catabolism, proteolysis, ubiquitin-proteasome, and autophagy.
Scroll horizontally to view entire data table
Composition of multi-omic atlas. A total of 121 experiments across multiple data sets were utilized to generate an epigenetic and transcriptional atlas of murine CD8+ T cells under chronic and acute antigen exposure. Unless stated, all CD8+ T cells were isolated from spleens.